
 Yahoo Finance
 If You Had Bought Stingray Group (TSE:RAY.A) Stock A Year Ago, You'd Be Sitting On A 19% Loss, Today

Stingray Group Inc. (TSE:RAY.A) shareholders should be happy to see the share price up 26% in the last quarter. But that doesn't change the fact that the returns over the last year have been less than pleasing. In fact the stock is down 19% in the last year, well below the market return.
Check out our latest analysis for Stingray Group
There is no denying that markets are sometimes efficient, but prices do not always reflect underlying business performance. One flawed but reasonable way to assess how sentiment around a company has changed is to compare the earnings per share (EPS) with the share price.
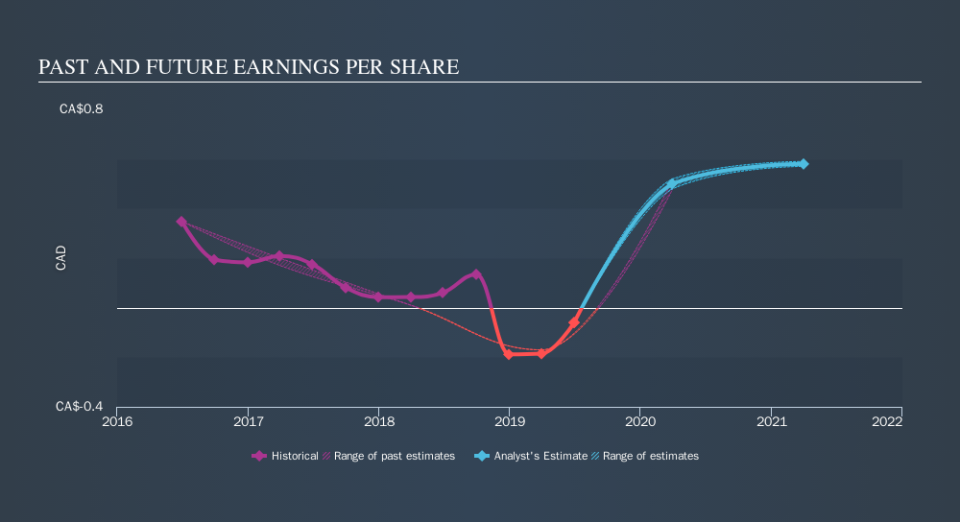
During the last year Stingray Group saw its earnings per share drop below zero. Buyers no doubt think it's a temporary situation, but those with a nose for quality have low tolerance for losses. Of course, if the company can turn the situation around, investors will likely profit.
The image below shows how EPS has tracked over time (if you click on the image you can see greater detail).
It's good to see that there was some significant insider buying in the last three months. That's a positive. That said, we think earnings and revenue growth trends are even more important factors to consider. Before buying or selling a stock, we always recommend a close examination of historic growth trends, available here..
What About Dividends?
As well as measuring the share price return, investors should also consider the total shareholder return (TSR). Whereas the share price return only reflects the change in the share price, the TSR includes the value of dividends (assuming they were reinvested) and the benefit of any discounted capital raising or spin-off. Arguably, the TSR gives a more comprehensive picture of the return generated by a stock. We note that for Stingray Group the TSR over the last year was -16%, which is better than the share price return mentioned above. And there's no prize for guessing that the dividend payments largely explain the divergence!
A Different Perspective
The last twelve months weren't great for Stingray Group shares, which cost holders 16%, including dividends, while the market was up about 0.9%. However, keep in mind that even the best stocks will sometimes underperform the market over a twelve month period. Investors are up over three years, booking 3.5% per year, much better than the more recent returns. Sometimes when a good quality long term winner has a weak period, it's turns out to be an opportunity, but you really need to be sure that the quality is there. If you want to research this stock further, the data on insider buying is an obvious place to start. You can click here to see who has been buying shares - and the price they paid.
Stingray Group is not the only stock that insiders are buying. For those who like to find winning investments this free list of growing companies with recent insider purchasing, could be just the ticket.
Please note, the market returns quoted in this article reflect the market weighted average returns of stocks that currently trade on CA exchanges.
We aim to bring you long-term focused research analysis driven by fundamental data. Note that our analysis may not factor in the latest price-sensitive company announcements or qualitative material.
If you spot an error that warrants correction, please contact the editor at editorial-team@simplywallst.com. This article by Simply Wall St is general in nature. It does not constitute a recommendation to buy or sell any stock, and does not take account of your objectives, or your financial situation. Simply Wall St has no position in the stocks mentioned. Thank you for reading.
