
 Yahoo Finance
 If You Had Bought Redwood Trust (NYSE:RWT) Stock Three Years Ago, You Could Pocket A 20% Gain Today

Investors can buy low cost index fund if they want to receive the average market return. But if you invest in individual stocks, some are likely to underperform. For example, the Redwood Trust, Inc. (NYSE:RWT) share price return of 20% over three years lags the market return in the same period. In the last year the stock price gained, albeit only 3.8%.
See our latest analysis for Redwood Trust
To paraphrase Benjamin Graham: Over the short term the market is a voting machine, but over the long term it's a weighing machine. One flawed but reasonable way to assess how sentiment around a company has changed is to compare the earnings per share (EPS) with the share price.
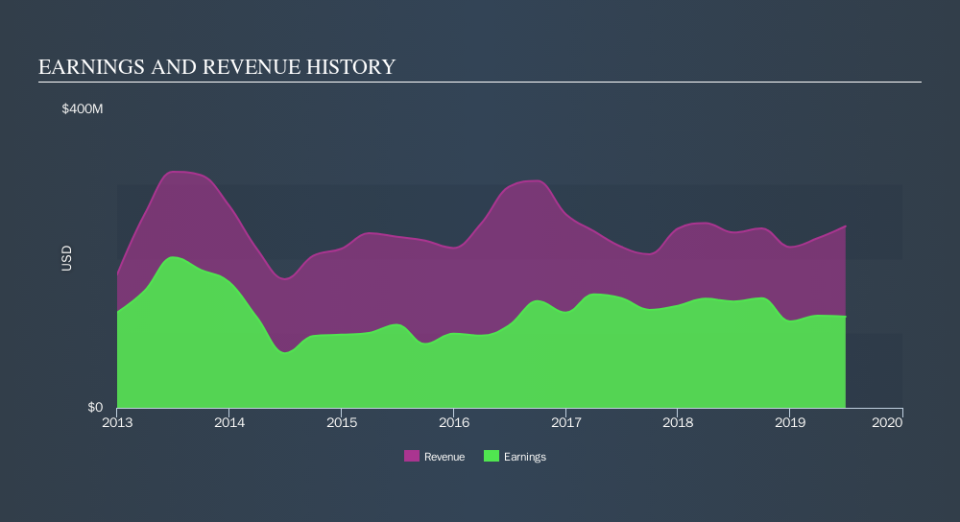
During the three years of share price growth, Redwood Trust actually saw its earnings per share (EPS) drop 0.2% per year.
Companies are not always focussed on EPS growth in the short term, and looking at how the share price has reacted, we don't think EPS is the most important metric for Redwood Trust at the moment. Therefore, it makes sense to look into other metrics.
We note that the dividend is higher than it was preciously, so that may have assisted the share price. Sometimes yield-chasing investors will flock to a company if they think the dividend can grow over time.
You can see how earnings and revenue have changed over time in the image below (click on the chart to see the exact values).
This free interactive report on Redwood Trust's balance sheet strength is a great place to start, if you want to investigate the stock further.
What About Dividends?
As well as measuring the share price return, investors should also consider the total shareholder return (TSR). The TSR incorporates the value of any spin-offs or discounted capital raisings, along with any dividends, based on the assumption that the dividends are reinvested. Arguably, the TSR gives a more comprehensive picture of the return generated by a stock. We note that for Redwood Trust the TSR over the last 3 years was 49%, which is better than the share price return mentioned above. The dividends paid by the company have thusly boosted the total shareholder return.
A Different Perspective
It's nice to see that Redwood Trust shareholders have received a total shareholder return of 12% over the last year. That's including the dividend. That gain is better than the annual TSR over five years, which is 6.1%. Therefore it seems like sentiment around the company has been positive lately. In the best case scenario, this may hint at some real business momentum, implying that now could be a great time to delve deeper. Most investors take the time to check the data on insider transactions. You can click here to see if insiders have been buying or selling.
If you would prefer to check out another company -- one with potentially superior financials -- then do not miss this free list of companies that have proven they can grow earnings.
Please note, the market returns quoted in this article reflect the market weighted average returns of stocks that currently trade on US exchanges.
We aim to bring you long-term focused research analysis driven by fundamental data. Note that our analysis may not factor in the latest price-sensitive company announcements or qualitative material.
If you spot an error that warrants correction, please contact the editor at editorial-team@simplywallst.com. This article by Simply Wall St is general in nature. It does not constitute a recommendation to buy or sell any stock, and does not take account of your objectives, or your financial situation. Simply Wall St has no position in the stocks mentioned. Thank you for reading.
