
 Yahoo Finance
 If You Had Bought NiSource (NYSE:NI) Shares Five Years Ago You'd Have A Total Return Of 118%

It's possible to achieve returns close to the market-weighted average return by buying an index fund. But if you pick the right individual stocks, you could make more -- or less -- than that. The NiSource Inc. (NYSE:NI) is down 26% over five years, but the total shareholder return is 118% once you include the dividend. And that total return actually beats the market return of 59%. There was little comfort for shareholders in the last week as the price declined a further 3.5%.
View our latest analysis for NiSource
There is no denying that markets are sometimes efficient, but prices do not always reflect underlying business performance. One way to examine how market sentiment has changed over time is to look at the interaction between a company's share price and its earnings per share (EPS).
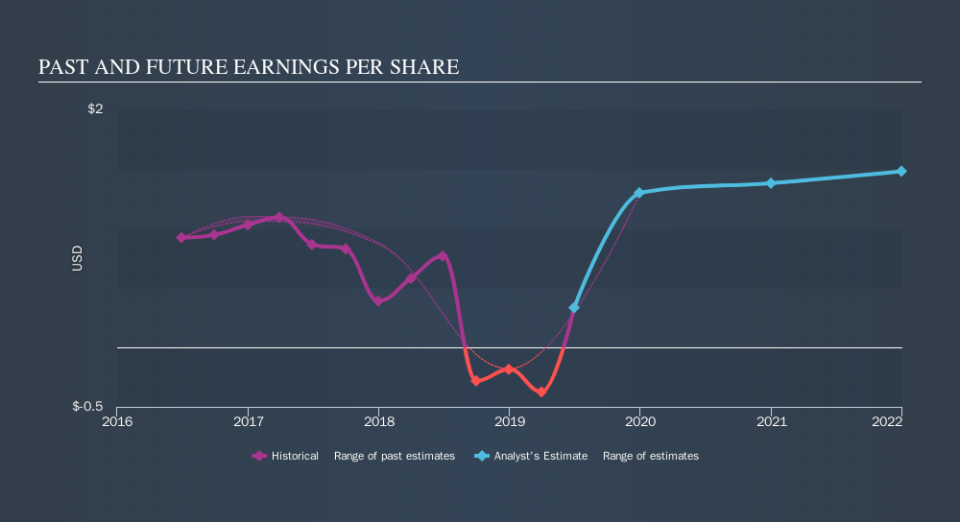
Looking back five years, both NiSource's share price and EPS declined; the latter at a rate of 23% per year. This fall in the EPS is worse than the 5.8% compound annual share price fall. The relatively muted share price reaction might be because the market expects the business to turn around. With a P/E ratio of 87.50, it's fair to say the market sees a brighter future for the business.
The graphic below depicts how EPS has changed over time (unveil the exact values by clicking on the image).
We're pleased to report that the CEO is remunerated more modestly than most CEOs at similarly capitalized companies. But while CEO remuneration is always worth checking, the really important question is whether the company can grow earnings going forward. Dive deeper into the earnings by checking this interactive graph of NiSource's earnings, revenue and cash flow.
What About Dividends?
As well as measuring the share price return, investors should also consider the total shareholder return (TSR). The TSR is a return calculation that accounts for the value of cash dividends (assuming that any dividend received was reinvested) and the calculated value of any discounted capital raisings and spin-offs. Arguably, the TSR gives a more comprehensive picture of the return generated by a stock. In the case of NiSource, it has a TSR of 118% for the last 5 years. That exceeds its share price return that we previously mentioned. This is largely a result of its dividend payments!
A Different Perspective
It's nice to see that NiSource shareholders have received a total shareholder return of 7.6% over the last year. Of course, that includes the dividend. However, that falls short of the 17% TSR per annum it has made for shareholders, each year, over five years. The pessimistic view would be that be that the stock has its best days behind it, but on the other hand the price might simply be moderating while the business itself continues to execute. Most investors take the time to check the data on insider transactions. You can click here to see if insiders have been buying or selling.
We will like NiSource better if we see some big insider buys. While we wait, check out this free list of growing companies with considerable, recent, insider buying.
Please note, the market returns quoted in this article reflect the market weighted average returns of stocks that currently trade on US exchanges.
We aim to bring you long-term focused research analysis driven by fundamental data. Note that our analysis may not factor in the latest price-sensitive company announcements or qualitative material.
If you spot an error that warrants correction, please contact the editor at editorial-team@simplywallst.com. This article by Simply Wall St is general in nature. It does not constitute a recommendation to buy or sell any stock, and does not take account of your objectives, or your financial situation. Simply Wall St has no position in the stocks mentioned. Thank you for reading.
