
 Yahoo Finance
 If You Had Bought Newport Exploration (CVE:NWX) Shares Five Years Ago You'd Have A Total Return Of 60%
Want to participate in a short research study? Help shape the future of investing tools and you could win a $250 gift card!
While not a mind-blowing move, it is good to see that the Newport Exploration Ltd. (CVE:NWX) share price has gained 24% in the last three months.
Check out our latest analysis for Newport Exploration
While markets are a powerful pricing mechanism, share prices reflect investor sentiment, not just underlying business performance. One imperfect but simple way to consider how the market perception of a company has shifted is to compare the change in the earnings per share (EPS) with the share price movement.
During the five years over which the share price declined, Newport Exploration's earnings per share (EPS) dropped by 23% each year. This fall in the EPS is worse than the 10% compound annual share price fall. The relatively muted share price reaction might be because the market expects the business to turn around.
You can see below how EPS has changed over time (discover the exact values by clicking on the image).
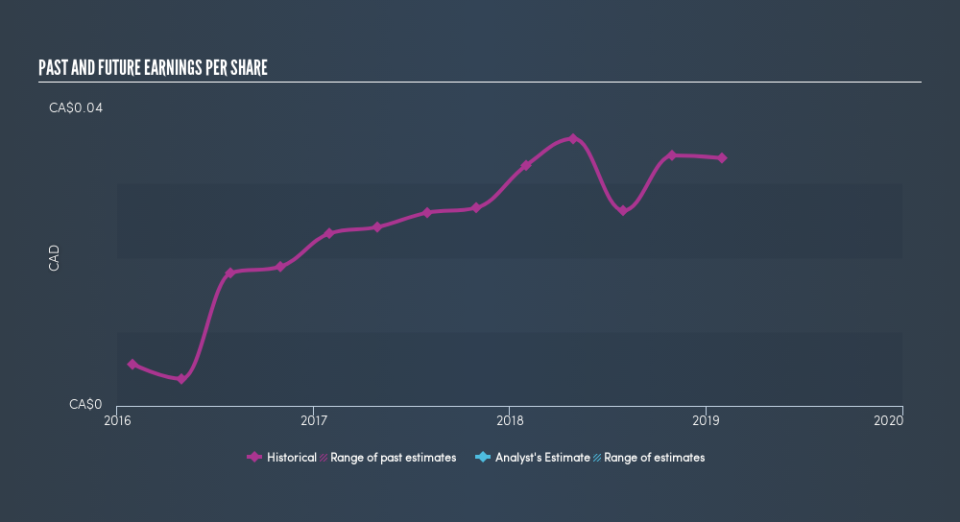
It might be well worthwhile taking a look at our free report on Newport Exploration's earnings, revenue and cash flow.
What about the Total Shareholder Return (TSR)?
Investors should note that there's a difference between Newport Exploration's total shareholder return (TSR) and its share price change, which we've covered above. The TSR is a return calculation that accounts for the value of cash dividends (assuming that any dividend received was reinvested) and the calculated value of any discounted capital raisings and spin-offs. Newport Exploration hasn't been paying dividends, but its TSR of 60% exceeds its share price return of -42%, implying it has either spun-off a business, or raised capital at a discount; thereby providing additional value to shareholders.
A Different Perspective
It's nice to see that Newport Exploration shareholders have received a total shareholder return of 9.5% over the last year. Having said that, the five-year TSR of 9.9% a year, is even better. Is Newport Exploration cheap compared to other companies? These 3 valuation measures might help you decide.
For those who like to find winning investments this free list of growing companies with recent insider purchasing, could be just the ticket.
Please note, the market returns quoted in this article reflect the market weighted average returns of stocks that currently trade on CA exchanges.
We aim to bring you long-term focused research analysis driven by fundamental data. Note that our analysis may not factor in the latest price-sensitive company announcements or qualitative material.
If you spot an error that warrants correction, please contact the editor at editorial-team@simplywallst.com. This article by Simply Wall St is general in nature. It does not constitute a recommendation to buy or sell any stock, and does not take account of your objectives, or your financial situation. Simply Wall St has no position in the stocks mentioned. Thank you for reading.
