
 Yahoo Finance
 If You Had Bought Innergex Renewable Energy (TSE:INE) Shares Five Years Ago You'd Have Made 35%

Generally speaking the aim of active stock picking is to find companies that provide returns that are superior to the market average. And the truth is, you can make significant gains if you buy good quality businesses at the right price. For example, long term Innergex Renewable Energy Inc. (TSE:INE) shareholders have enjoyed a 35% share price rise over the last half decade, well in excess of the market return of around 7.1% (not including dividends). On the other hand, the more recent gains haven't been so impressive, with shareholders gaining just 9.4%, including dividends.
Check out our latest analysis for Innergex Renewable Energy
There is no denying that markets are sometimes efficient, but prices do not always reflect underlying business performance. One way to examine how market sentiment has changed over time is to look at the interaction between a company's share price and its earnings per share (EPS).
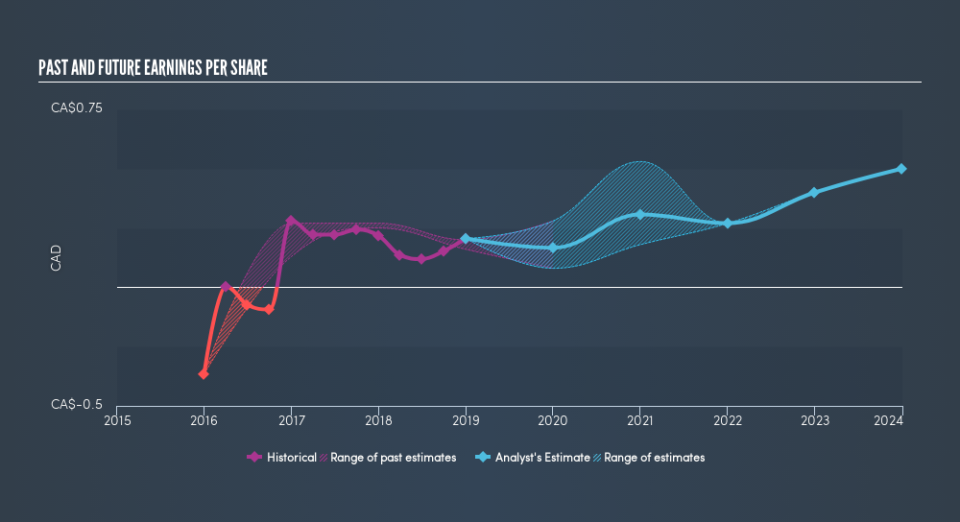
During the five years of share price growth, Innergex Renewable Energy moved from a loss to profitability. That's generally thought to be a genuine positive, so we would expect to see an increasing share price.
The graphic below depicts how EPS has changed over time (unveil the exact values by clicking on the image).
It's probably worth noting that the CEO is paid less than the median at similar sized companies. It's always worth keeping an eye on CEO pay, but a more important question is whether the company will grow earnings throughout the years. Before buying or selling a stock, we always recommend a close examination of historic growth trends, available here..
What About Dividends?
When looking at investment returns, it is important to consider the difference between total shareholder return (TSR) and share price return. Whereas the share price return only reflects the change in the share price, the TSR includes the value of dividends (assuming they were reinvested) and the benefit of any discounted capital raising or spin-off. So for companies that pay a generous dividend, the TSR is often a lot higher than the share price return. In the case of Innergex Renewable Energy, it has a TSR of 74% for the last 5 years. That exceeds its share price return that we previously mentioned. This is largely a result of its dividend payments!
A Different Perspective
It's good to see that Innergex Renewable Energy has rewarded shareholders with a total shareholder return of 9.4% in the last twelve months. Of course, that includes the dividend. Having said that, the five-year TSR of 12% a year, is even better. Most investors take the time to check the data on insider transactions. You can click here to see if insiders have been buying or selling.
For those who like to find winning investments this free list of growing companies with recent insider purchasing, could be just the ticket.
Please note, the market returns quoted in this article reflect the market weighted average returns of stocks that currently trade on CA exchanges.
We aim to bring you long-term focused research analysis driven by fundamental data. Note that our analysis may not factor in the latest price-sensitive company announcements or qualitative material.
If you spot an error that warrants correction, please contact the editor at editorial-team@simplywallst.com. This article by Simply Wall St is general in nature. It does not constitute a recommendation to buy or sell any stock, and does not take account of your objectives, or your financial situation. Simply Wall St has no position in the stocks mentioned. Thank you for reading.
