If You Had Bought IBI Group (TSE:IBG) Shares Five Years Ago You'd Have Made 89%

When we invest, we're generally looking for stocks that outperform the market average. Buying under-rated businesses is one path to excess returns. To wit, the IBI Group share price has climbed 89% in five years, easily topping the market return of 7.6% (ignoring dividends). On the other hand, the more recent gains haven't been so impressive, with shareholders gaining just 19%.
Check out our latest analysis for IBI Group
To quote Buffett, 'Ships will sail around the world but the Flat Earth Society will flourish. There will continue to be wide discrepancies between price and value in the marketplace...' By comparing earnings per share (EPS) and share price changes over time, we can get a feel for how investor attitudes to a company have morphed over time.
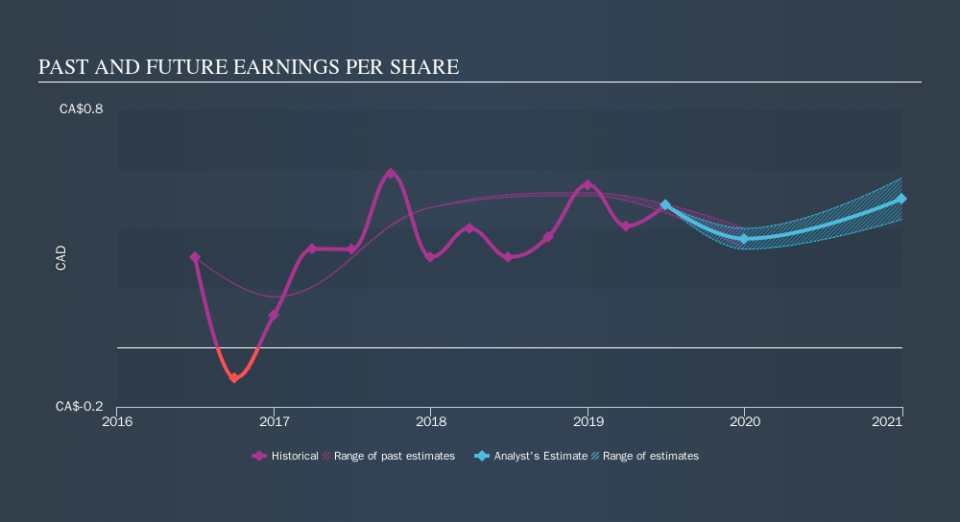
During the last half decade, IBI Group became profitable. That's generally thought to be a genuine positive, so we would expect to see an increasing share price. Given that the company made a profit three years ago, but not five years ago, it is worth looking at the share price returns over the last three years, too. We can see that the IBI Group share price is down 23% in the last three years. During the same period, EPS grew by 16% each year. It would appear there's a real mismatch between the increasing EPS and the share price, which has declined -8.5% a year for three years.
The image below shows how EPS has tracked over time (if you click on the image you can see greater detail).
We consider it positive that insiders have made significant purchases in the last year. Even so, future earnings will be far more important to whether current shareholders make money. It might be well worthwhile taking a look at our free report on IBI Group's earnings, revenue and cash flow.
A Different Perspective
It's good to see that IBI Group has rewarded shareholders with a total shareholder return of 19% in the last twelve months. Since the one-year TSR is better than the five-year TSR (the latter coming in at 14% per year), it would seem that the stock's performance has improved in recent times. Someone with an optimistic perspective could view the recent improvement in TSR as indicating that the business itself is getting better with time. It is all well and good that insiders have been buying shares, but we suggest you check here to see what price insiders were buying at.
If you like to buy stocks alongside management, then you might just love this free list of companies. (Hint: insiders have been buying them).
Please note, the market returns quoted in this article reflect the market weighted average returns of stocks that currently trade on CA exchanges.
We aim to bring you long-term focused research analysis driven by fundamental data. Note that our analysis may not factor in the latest price-sensitive company announcements or qualitative material.
If you spot an error that warrants correction, please contact the editor at editorial-team@simplywallst.com. This article by Simply Wall St is general in nature. It does not constitute a recommendation to buy or sell any stock, and does not take account of your objectives, or your financial situation. Simply Wall St has no position in the stocks mentioned. Thank you for reading.

 Yahoo Finance
