
 Yahoo Finance
 If You Had Bought Gowing Bros' (ASX:GOW) Shares Three Years Ago You Would Be Down 58%

The truth is that if you invest for long enough, you're going to end up with some losing stocks. But long term Gowing Bros. Limited (ASX:GOW) shareholders have had a particularly rough ride in the last three year. Sadly for them, the share price is down 58% in that time. And over the last year the share price fell 39%, so we doubt many shareholders are delighted.
See our latest analysis for Gowing Bros
There is no denying that markets are sometimes efficient, but prices do not always reflect underlying business performance. By comparing earnings per share (EPS) and share price changes over time, we can get a feel for how investor attitudes to a company have morphed over time.
Over the three years that the share price declined, Gowing Bros' earnings per share (EPS) dropped significantly, falling to a loss. Extraordinary items contributed to this situation. Since the company has fallen to a loss making position, it's hard to compare the change in EPS with the share price change. But it's safe to say we'd generally expect the share price to be lower as a result!
The image below shows how EPS has tracked over time (if you click on the image you can see greater detail).
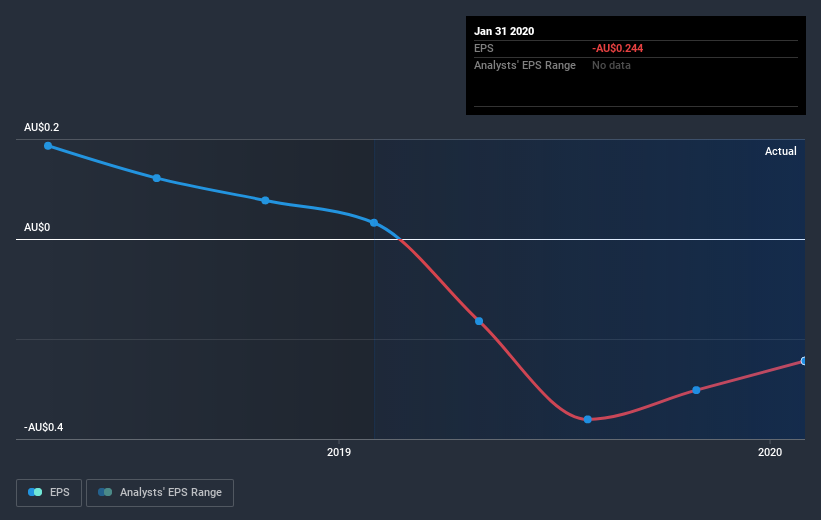
Dive deeper into Gowing Bros' key metrics by checking this interactive graph of Gowing Bros's earnings, revenue and cash flow.
What About Dividends?
It is important to consider the total shareholder return, as well as the share price return, for any given stock. The TSR incorporates the value of any spin-offs or discounted capital raisings, along with any dividends, based on the assumption that the dividends are reinvested. Arguably, the TSR gives a more comprehensive picture of the return generated by a stock. In the case of Gowing Bros, it has a TSR of -52% for the last 3 years. That exceeds its share price return that we previously mentioned. And there's no prize for guessing that the dividend payments largely explain the divergence!
A Different Perspective
While the broader market lost about 3.2% in the twelve months, Gowing Bros shareholders did even worse, losing 35% (even including dividends). Having said that, it's inevitable that some stocks will be oversold in a falling market. The key is to keep your eyes on the fundamental developments. Regrettably, last year's performance caps off a bad run, with the shareholders facing a total loss of 7.3% per year over five years. We realise that Baron Rothschild has said investors should "buy when there is blood on the streets", but we caution that investors should first be sure they are buying a high quality business. I find it very interesting to look at share price over the long term as a proxy for business performance. But to truly gain insight, we need to consider other information, too. Consider for instance, the ever-present spectre of investment risk. We've identified 4 warning signs with Gowing Bros (at least 2 which make us uncomfortable) , and understanding them should be part of your investment process.
We will like Gowing Bros better if we see some big insider buys. While we wait, check out this free list of growing companies with considerable, recent, insider buying.
Please note, the market returns quoted in this article reflect the market weighted average returns of stocks that currently trade on AU exchanges.
This article by Simply Wall St is general in nature. It does not constitute a recommendation to buy or sell any stock, and does not take account of your objectives, or your financial situation. We aim to bring you long-term focused analysis driven by fundamental data. Note that our analysis may not factor in the latest price-sensitive company announcements or qualitative material. Simply Wall St has no position in any stocks mentioned.
Have feedback on this article? Concerned about the content? Get in touch with us directly. Alternatively, email editorial-team@simplywallst.com.
