
 Yahoo Finance
 If You Had Bought Goldman Sachs Group (NYSE:GS) Stock Three Years Ago, You Could Pocket A 20% Gain Today

Buying a low-cost index fund will get you the average market return. But in any diversified portfolio of stocks, you'll see some that fall short of the average. Unfortunately for shareholders, while the The Goldman Sachs Group, Inc. (NYSE:GS) share price is up 20% in the last three years, that falls short of the market return. Zooming in, the stock is actually down 6.9% in the last year.
See our latest analysis for Goldman Sachs Group
While markets are a powerful pricing mechanism, share prices reflect investor sentiment, not just underlying business performance. One imperfect but simple way to consider how the market perception of a company has shifted is to compare the change in the earnings per share (EPS) with the share price movement.
During three years of share price growth, Goldman Sachs Group achieved compound earnings per share growth of 31% per year. The average annual share price increase of 6.1% is actually lower than the EPS growth. So it seems investors have become more cautious about the company, over time. This cautious sentiment is reflected in its (fairly low) P/E ratio of 8.58.
The graphic below depicts how EPS has changed over time (unveil the exact values by clicking on the image).
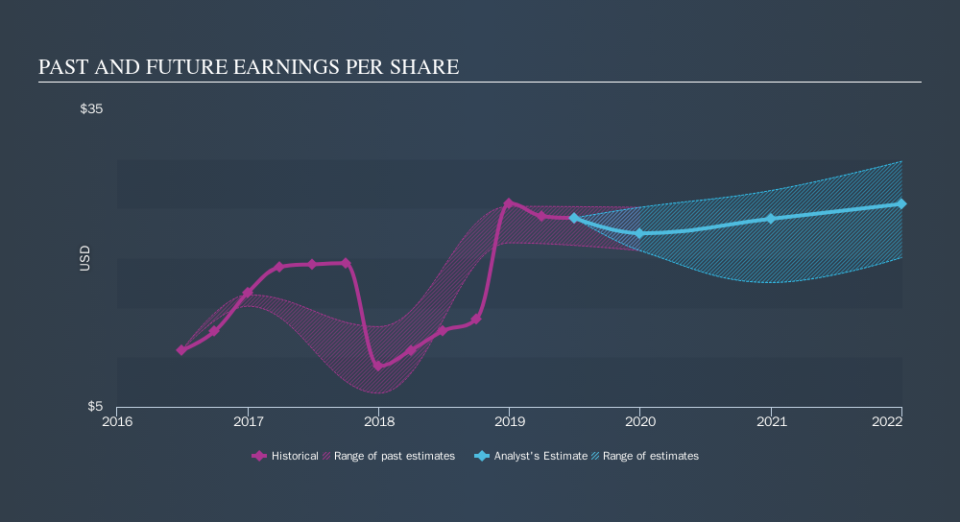
It is of course excellent to see how Goldman Sachs Group has grown profits over the years, but the future is more important for shareholders. You can see how its balance sheet has strengthened (or weakened) over time in this free interactive graphic.
What About Dividends?
As well as measuring the share price return, investors should also consider the total shareholder return (TSR). The TSR is a return calculation that accounts for the value of cash dividends (assuming that any dividend received was reinvested) and the calculated value of any discounted capital raisings and spin-offs. It's fair to say that the TSR gives a more complete picture for stocks that pay a dividend. We note that for Goldman Sachs Group the TSR over the last 3 years was 25%, which is better than the share price return mentioned above. And there's no prize for guessing that the dividend payments largely explain the divergence!
A Different Perspective
Goldman Sachs Group shareholders are down 5.1% for the year (even including dividends) , but the market itself is up 7.7%. Even the share prices of good stocks drop sometimes, but we want to see improvements in the fundamental metrics of a business, before getting too interested. Longer term investors wouldn't be so upset, since they would have made 4.3%, each year, over five years. If the fundamental data continues to indicate long term sustainable growth, the current sell-off could be an opportunity worth considering. Before spending more time on Goldman Sachs Group it might be wise to click here to see if insiders have been buying or selling shares.
We will like Goldman Sachs Group better if we see some big insider buys. While we wait, check out this free list of growing companies with considerable, recent, insider buying.
Please note, the market returns quoted in this article reflect the market weighted average returns of stocks that currently trade on US exchanges.
We aim to bring you long-term focused research analysis driven by fundamental data. Note that our analysis may not factor in the latest price-sensitive company announcements or qualitative material.
If you spot an error that warrants correction, please contact the editor at editorial-team@simplywallst.com. This article by Simply Wall St is general in nature. It does not constitute a recommendation to buy or sell any stock, and does not take account of your objectives, or your financial situation. Simply Wall St has no position in the stocks mentioned. Thank you for reading.
