
 Yahoo Finance
 If You Had Bought C-Com Satellite Systems (CVE:CMI) Stock A Year Ago, You Could Pocket A 68% Gain Today

Want to participate in a short research study? Help shape the future of investing tools and you could win a $250 gift card!
Passive investing in index funds can generate returns that roughly match the overall market. But one can do better than that by picking better than average stocks (as part of a diversified portfolio). To wit, the C-Com Satellite Systems Inc. (CVE:CMI) share price is 68% higher than it was a year ago, much better than the market return of around -2.7% (not including dividends) in the same period. So that should have shareholders smiling. Looking back further, the stock price is 48% higher than it was three years ago.
See our latest analysis for C-Com Satellite Systems
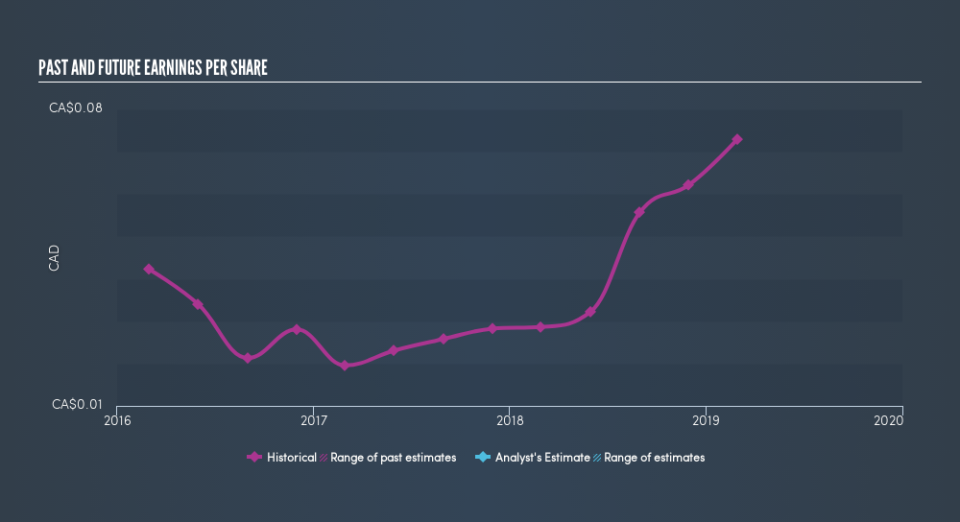
To paraphrase Benjamin Graham: Over the short term the market is a voting machine, but over the long term it's a weighing machine. By comparing earnings per share (EPS) and share price changes over time, we can get a feel for how investor attitudes to a company have morphed over time.
During the last year C-Com Satellite Systems grew its earnings per share (EPS) by 155%. It's fair to say that the share price gain of 68% did not keep pace with the EPS growth. So it seems like the market has cooled on C-Com Satellite Systems, despite the growth. Interesting.
The company's earnings per share (over time) is depicted in the image below (click to see the exact numbers).
It might be well worthwhile taking a look at our free report on C-Com Satellite Systems's earnings, revenue and cash flow.
What About Dividends?
It is important to consider the total shareholder return, as well as the share price return, for any given stock. The TSR incorporates the value of any spin-offs or discounted capital raisings, along with any dividends, based on the assumption that the dividends are reinvested. Arguably, the TSR gives a more comprehensive picture of the return generated by a stock. We note that for C-Com Satellite Systems the TSR over the last year was 74%, which is better than the share price return mentioned above. This is largely a result of its dividend payments!
A Different Perspective
It's nice to see that C-Com Satellite Systems shareholders have received a total shareholder return of 74% over the last year. Of course, that includes the dividend. That's better than the annualised return of 8.0% over half a decade, implying that the company is doing better recently. Given the share price momentum remains strong, it might be worth taking a closer look at the stock, lest you miss an opportunity. Before spending more time on C-Com Satellite Systems it might be wise to click here to see if insiders have been buying or selling shares.
For those who like to find winning investments this free list of growing companies with recent insider purchasing, could be just the ticket.
Please note, the market returns quoted in this article reflect the market weighted average returns of stocks that currently trade on CA exchanges.
We aim to bring you long-term focused research analysis driven by fundamental data. Note that our analysis may not factor in the latest price-sensitive company announcements or qualitative material.
If you spot an error that warrants correction, please contact the editor at editorial-team@simplywallst.com. This article by Simply Wall St is general in nature. It does not constitute a recommendation to buy or sell any stock, and does not take account of your objectives, or your financial situation. Simply Wall St has no position in the stocks mentioned. Thank you for reading.