
 Yahoo Finance
 GT Gold files Technical Report for Saddle North project maiden Mineral Resource estimate for its Tatogga property in British Columbia, Canada
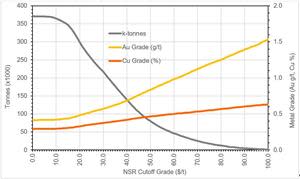
Figure 1

Grade-Tonnage Curve for Open Pit Resource at NSR Cut-Offs
Figure 2
Grade-Tonnage Curve for Underground Resource at NSR Cut-Offs
VANCOUVER, British Columbia, Aug. 20, 2020 (GLOBE NEWSWIRE) -- GT Gold Corp. (TSX-V:GTT) (the “Company” or “GT Gold”) is pleased to provide notice that a National Instrument 43-101 technical report (“NI 43-101” or “Technical Report”) has been filed with Canadian securities regulators to support the maiden mineral resource estimate (“Mineral Resource”) for the Saddle North project (“Saddle North”) on the Company’s 100%-owned Tatogga property, located in northwestern British Columbia, Canada.
Paul Harbidge, President and CEO stated, “We are delighted to file the technical report in support of the previously disclosed maiden mineral resources for Saddle North, which marks another significant step for the company. An updated sensitivity analysis supports the presence of the continuous higher-grade core of mineralization, which has the potential to drive the value for our next key milestone, the Preliminary Economic Study”.
Highlights:
The large mineral resource comprises an Indicated resource containing 1.81 Blb copper and 3.47 Moz gold and an Inferred resource containing 2.98 Blb copper and 5.46 Moz gold.
Continuous higher-grade central core of mineralization within the deposit offers optionality and flexibility to be studied as part of the Preliminary Economic Assessment (“PEA”) to drive value.
Good metallurgical results point to a simple process, with conventional flowsheet and clean concentrate.
Excellent local infrastructure with a main highway crossing the property, a hydro powerline within easy access and a nearby deep-water port at Stewart, British Columbia.
The topography of the property is highly favorable for the potential future development of the project both in terms of open pit and underground operations.
Highly prospective exploration with the Saddle North deposit remaining open along strike and at depth. Saddle South provides additional project potential, it is only three kilometres from Saddle North and consists of a precious metal rich sheeted vein system. There are additional untested targets in proximity to Saddle North and South. At the new Quash Pass target, where there are two multi-kilometre anomalous trends, phase 1 diamond drilling is underway.
The Preliminary Economic Assessment is underway and will examine mining options, which are made possible by the size, grade and mineral distribution in the deposit. These will include:
A starter pit that accesses the easily mineable surface ±150m which is situated at the top of a gently-sloping valley
An underground operation, accessing the higher-grade core through a decline and which uses lower cost bulk mining methods
The Technical Report, dated effective August 20, 2020, is titled " NI 43-101 Technical Report on the Saddle North Copper-Gold Project" and is available under the Company's profile on SEDAR (www.sedar.com).The Technical Report was authored by Richard Flynn, P.Geo., Principal, Next Mine Consulting Ltd., who is a qualified person within the meaning of NI 43-101, is independent of the Company and has reviewed and approved the disclosure regarding the resource estimate for GT Gold disclosed herein.
The Mineral Resource and Technical Report for the Saddle North gold-rich copper porphyry system is founded on the geological model completed in Q1 2020 (see press release dated April 28, 2020).
Saddle North Mineral Resource Estimate
The open pit and underground mine shape constrained Mineral Resources are summarized below in Table 1.
Table 1: Saddle North Mineral Resource
Tatogga Project Saddle North Mineral Resources Amenable to Open Pit Mining Methods | ||||||||||||
NSR cut-off $9.00/t (0.13 % CuEq) | ||||||||||||
Average Grade | Contained Metal | |||||||||||
Material Type | Category | Tonnes | Cu | Au | Ag | NSR | CuEq | Cu | Au | Ag | NSR | CuEq |
(Mt) | (%) | (g/t) | (g/t) | ($/t) | (%) | (M lb) | (koz) | (koz) | $M | (M lb) | ||
Transition | Indicated | 21 | 0.15 | 0.16 | 0.5 | 17.09 | 0.24 | 72 | 108 | 340 | 364 | 112 |
Inferred | 13 | 0.20 | 0.12 | 0.6 | 19.23 | 0.27 | 58 | 49 | 260 | 250 | 76 | |
Fresh | Indicated | 196 | 0.26 | 0.30 | 0.7 | 30.15 | 0.42 | 1,105 | 1,906 | 4,210 | 5,903 | 1,808 |
Inferred | 241 | 0.22 | 0.25 | 0.5 | 25.48 | 0.35 | 1,174 | 1,907 | 4,090 | 6,129 | 1,877 | |
Total | Indicated | 217 | 0.25 | 0.29 | 0.7 | 28.87 | 0.40 | 1,177 | 2,014 | 4,550 | 6,267 | 1,920 |
Inferred | 254 | 0.22 | 0.24 | 0.5 | 25.16 | 0.35 | 1,232 | 1,956 | 4,350 | 6,379 | 1,953 | |
Tatogga Project Saddle North Mineral Resources Amenable to Underground Mining Methods | ||||||||||||
Within NSR $16/t cut-off (0.22% CuEq) Bulk Tonnage Underground Mining Shape | ||||||||||||
Average Grade | Contained Metal | |||||||||||
Material Type | Category | Tonnes | Cu | Au | Ag | NSR | CuEq | Cu | Au | Ag | NSR | CuEq |
(Mt) | (%) | (g/t) | (g/t) | ($/t) | (%) | (M lb) | (koz) | (koz) | $M | (M lb) | ||
Fresh | Indicated | 81 | 0.35 | 0.56 | 1.2 | 47.14 | 0.65 | 632 | 1,457 | 3,030 | 3,814 | 1,168 |
Inferred | 289 | 0.27 | 0.38 | 0.8 | 34.30 | 0.48 | 1,750 | 3,499 | 7,290 | 9,922 | 3,039 | |
Tatogga Project Saddle North for Combined Mining Methods | ||||||||||||
Average Grade | Contained Metal | |||||||||||
Material Type | Category | Tonnes | Cu | Au | Ag | NSR | CuEq | Cu | Au | Ag | NSR | CuEq |
(Mt) | (%) | (g/t) | (g/t) | ($/t) | (%) | (M lb) | (koz) | (koz) | $M | (M lb) | ||
Total | Indicated | 298 | 0.28 | 0.36 | 0.8 | 33.83 | 0.47 | 1,809 | 3,471 | 7,580 | 10,081 | 3,088 |
Inferred | 543 | 0.25 | 0.31 | 0.7 | 30.03 | 0.42 | 2,982 | 5,455 | 11,640 | 16,301 | 4,992 | |
Notes to Table 1:
Results are reported in-situ and diluted (underground resource) and are considered to have reasonable prospects for eventual economic extraction, but not unplanned dilution. Dilution in the underground estimate is approx. 5 Mt Indicated and 27 Mt Inferred avg. $12/t NSR.
As Independence is defined under NI 43-101, the Qualified Person is Mr. Richard Flynn, P.Geo. of Next Mine Consulting Ltd. (NMC), who is independent of GT Mining and has reviewed, validated, and takes responsibility for the Mineral Resource Estimates.
The block model was regularized to 15 m x 15 m x 15 m whole blocks using mineralization.
The effective date of the Mineral Resource estimate is July 6, 2020.
The number of metric tonnes are rounded to the nearest million, gold ounces are rounded to the nearest thousand and silver ounces were rounded to the nearest ten thousand. Any discrepancies in the totals are due to rounding.
Pit constrained Mineral Resources are reported in relation to a conceptual pit shell above an NSR cut-off of $9.00/t.
Underground Mineral Resources assume block-cave mining method that does not allow selectivity. A bulk mining shape based on an NSR cut-off of $16.00/t was used to constrain the estimate and all blocks within the cave shape were tabulated irrespective of grade.
Block tonnage was estimated from volumes using an average density per lithological unit. Specific gravity had a range of 2.75 to 2.86.
All copper, gold and silver assays have been capped prior to being composited at 15m, breaking at lithology and alteration contacts.
NSR calculation is based on a price of USD 3.25 per pound of copper, USD 1,500 per ounce of gold, USD 18 per ounce silver, and copper recoveries of 88%, gold recoveries of 67% and silver recoveries of 58%. Foreign Exchange assumption was $0.76 C$/US$.
Net Smelter Return (“NSR”) ($/t) = (Cu% x 2204.62 lb/t x Cu Recovery x payable% x Cu CAD Price) + (Au g/t ÷ 31.1035 g/ounce x Au Recovery x Au CAD Price x payable%) + (Ag g/t ÷ 31.1035 g/ounce x Ag Recovery x Ag CAD Price x payable%).
Copper Equivalent in % (CuEq) = Cu% + Au g/t * 0.53 + Ag g/t * 0.005.
All values in Canadian dollars unless otherwise stated.
Differences may occur in totals due to rounding.
Transition-Sulphide boundary determined from visual logging (weak oxidation in transition material limited to fracture plane surfaces).
The CIM Definition Standards (May 10, 2014) were followed for classification of Mineral Resource.
Figure 1: Grade-Tonnage Curve for Open Pit Resource at NSR Cut-Offs
https://www.globenewswire.com/NewsRoom/AttachmentNg/a5bc64c2-eac8-49fa-a52b-4f978d39fa2e
Figure 2: Grade-Tonnage Curve for Underground Resource at NSR Cut-Offs
https://www.globenewswire.com/NewsRoom/AttachmentNg/7859905e-4f06-4c55-9f04-d4eec53a62e8
Table 2: Open Pit Mineral Resource Sensitivity to changes in NSR Cut-Off.
Saddle North Open Pit Mineral Resource Sensitivity to NSR Cut-Off Changes | ||||||
Category | NSR | Average Grade | Contained | |||
Cut-Off | Tonnes | Cu | Au | Cu | Au | |
($/t) | (Mt) | (%) | (g/t) | (M lb) | (koz) | |
Indicated | 7.50 | 222 | 0.24 | 0.28 | 1,183 | 2,027 |
9.00 | 217 | 0.25 | 0.29 | 1,177 | 2,014 | |
10.50 | 210 | 0.25 | 0.30 | 1,164 | 1,992 | |
12.00 | 201 | 0.26 | 0.30 | 1,144 | 1,959 | |
13.50 | 187 | 0.27 | 0.32 | 1,109 | 1,908 | |
15.00 | 171 | 0.28 | 0.34 | 1,064 | 1,845 | |
20.00 | 131 | 0.32 | 0.39 | 923 | 1,645 | |
25.00 | 97 | 0.36 | 0.46 | 773 | 1,423 | |
30.00 | 70 | 0.41 | 0.53 | 628 | 1,202 | |
35.00 | 55 | 0.44 | 0.60 | 531 | 1,054 | |
40.00 | 44 | 0.47 | 0.66 | 452 | 927 | |
50.00 | 24 | 0.55 | 0.84 | 291 | 650 | |
60.00 | 15 | 0.59 | 1.01 | 195 | 487 | |
Inferred | 7.50 | 261 | 0.22 | 0.24 | 1,243 | 1,979 |
9.00 | 254 | 0.22 | 0.24 | 1,232 | 1,957 | |
10.50 | 244 | 0.23 | 0.25 | 1,215 | 1,927 | |
12.00 | 229 | 0.23 | 0.26 | 1,181 | 1,878 | |
13.50 | 216 | 0.24 | 0.26 | 1,146 | 1,829 | |
15.00 | 200 | 0.25 | 0.27 | 1,099 | 1,765 | |
20.00 | 129 | 0.30 | 0.34 | 851 | 1,417 | |
25.00 | 83 | 0.35 | 0.42 | 646 | 1,126 | |
30.00 | 59 | 0.39 | 0.50 | 511 | 945 | |
35.00 | 43 | 0.43 | 0.59 | 407 | 809 | |
40.00 | 33 | 0.45 | 0.65 | 327 | 692 | |
50.00 | 18 | 0.51 | 0.82 | 202 | 475 | |
60.00 | 11 | 0.55 | 0.97 | 134 | 344 | |
Notes to Table 2: See above notes for Table 1
Silver has been ignored in the sensitivity analysis below, in tables 2 and 3 for simplicity of reporting
Table 3: Underground Mineral Resource Sensitivity to changes in NSR Cut-Off.
Saddle North Underground Mineral Resource Sensitivity to NSR Cut-Off Changes | ||||||
Category | UG Shape | Average Grade | Contained | |||
NSR | Tonnes | Cu | Au | Cu | Au | |
($/t) | (Mt) | (%) | (g/t) | (M lb) | (koz) | |
Indicated | 16.00 | 81 | 0.35 | 0.56 | 632 | 1,457 |
20.00 | 71 | 0.38 | 0.62 | 598 | 1,406 | |
25.00 | 65 | 0.40 | 0.65 | 574 | 1,368 | |
40.00 | 46 | 0.45 | 0.78 | 462 | 1,161 | |
50.00 | 34 | 0.48 | 0.89 | 362 | 973 | |
60.00 | 23 | 0.51 | 1.01 | 258 | 747 | |
Inferred | 16.00 | 289 | 0.27 | 0.38 | 1,750 | 3,499 |
20.00 | 228 | 0.31 | 0.44 | 1,563 | 3,212 | |
25.00 | 188 | 0.34 | 0.48 | 1,397 | 2,930 | |
40.00 | 93 | 0.40 | 0.64 | 824 | 1,911 | |
50.00 | 46 | 0.45 | 0.80 | 457 | 1,177 | |
60.00 | 23 | 0.49 | 0.95 | 249 | 702 | |
Notes to Table 3: See above notes for Table 1
Data Verification
The data described above is supported by using industry standard QA/QC procedures consisting of the insertion of certified standards and blanks into the sample stream and utilizing certified independent analytical laboratories for all assays. Historical QA/QC data and methodology on the project were reviewed and are summarized in the NI 43-101 Technical Report. The qualified person detected minor but no significant QA/QC issues during review of the data.
All geological data used in the mineral resource estimate was reviewed and verified by Richard Flynn, P.Geo, of Next Mine Consulting Ltd. who made two site visits in June of 2020. Site visits included:
review of GT Gold’s logging and sampling techniques
viewing of core from seven Saddle North boreholes
confirmation of borehole collar field locations
Qualified Person
In accordance with National Instrument 43-101 Standards of Disclosure for Mineral Projects, Michael Skead, FAusIMM, Vice President Projects, is the Qualified Person for the Company and has validated and approved the technical and scientific content of this news release.
Risk Factors
GT Gold is aware this project is subject to the same types of risks that large base metal projects experience at an early stage of development in northern British Columbia. The Company has engaged experienced management and specialized consultants to identify, manage and mitigate those risks. However, the types of risks will change as the project evolves and more information becomes available.
About GT Gold
GT Gold is focused on exploring for base and precious metals in the geologically prolific terrain of British Columbia’s renowned Golden Triangle. The Company’s flagship asset is the wholly-owned, 46,827 hectare Tatogga property, located near Iskut, British Columbia, upon which it made two significant discoveries in 2017 and 2018 at its Saddle prospect: a precious metal rich vein system at Saddle South and a gold-rich copper porphyry system at Saddle North.
For further information, please contact:
GT Gold Corp. | GT Gold Corp. |
Cautionary Statement Regarding Forward Looking Statements
This news release contains forward-looking statements and forward-looking information (together, "forward-looking statements") within the meaning of applicable securities laws. All statements, other than statements of historical facts, are forward-looking statements. Generally, forward-looking statements can be identified by the use of terminology such as "plans", "expects”, "estimates", "intends", "anticipates", "believes" or variations of such words, or statements that certain actions, events or results "may", "could", "would", "might", "will be taken", "occur" or "be achieved". Forward looking statements involve risks, uncertainties and other factors disclosed under the heading “Risk Factors” and elsewhere in the Company’s filings with Canadian securities regulators, that could cause actual results, performance, prospects and opportunities to differ materially from those expressed or implied by such forward-looking statements. Although the Company believes that the assumptions and factors used in preparing these forward-looking statements are reasonable based upon the information currently available to management as of the date hereof, actual results and developments may differ materially from those contemplated by these statements. Readers are therefore cautioned not to place undue reliance on these statements, which only apply as of the date of this news release, and no assurance can be given that such events will occur in the disclosed times frames or at all. Except where required by applicable law, the Company disclaims any intention or obligation to update or revise any forward-looking statement, whether as a result of new information, future events or otherwise. Neither the TSX Venture Exchange nor its Regulation Services Provider (as that term is defined in the policies of the TSX Venture Exchange) accepts responsibility for the adequacy or accuracy of this release.
