
 Yahoo Finance
 Should Greif, Inc. (NYSE:GEF) Be Part Of Your Dividend Portfolio?

Today we'll take a closer look at Greif, Inc. (NYSE:GEF) from a dividend investor's perspective. Owning a strong business and reinvesting the dividends is widely seen as an attractive way of growing your wealth. If you are hoping to live on your dividends, it's important to be more stringent with your investments than the average punter. Regular readers know we like to apply the same approach to each dividend stock, and we hope you'll find our analysis useful.
A high yield and a long history of paying dividends is an appealing combination for Greif. It would not be a surprise to discover that many investors buy it for the dividends. When buying stocks for their dividends, you should always run through the checks below, to see if the dividend looks sustainable.
Explore this interactive chart for our latest analysis on Greif!
Payout ratios
Companies (usually) pay dividends out of their earnings. If a company is paying more than it earns, the dividend might have to be cut. So we need to form a view on if a company's dividend is sustainable, relative to its net profit after tax. Greif paid out 58% of its profit as dividends, over the trailing twelve month period. This is a healthy payout ratio, and while it does limit the amount of earnings that can be reinvested in the business, there is also some room to lift the payout ratio over time.
Another important check we do is to see if the free cash flow generated is sufficient to pay the dividend. Of the free cash flow it generated last year, Greif paid out 45% as dividends, suggesting the dividend is affordable. It's positive to see that Greif's dividend is covered by both profits and cash flow, since this is generally a sign that the dividend is sustainable, and a lower payout ratio usually suggests a greater margin of safety before the dividend gets cut.
Is Greif's Balance Sheet Risky?
As Greif has a meaningful amount of debt, we need to check its balance sheet to see if the company might have debt risks. A rough way to check this is with these two simple ratios: a) net debt divided by EBITDA (earnings before interest, tax, depreciation and amortisation), and b) net interest cover. Net debt to EBITDA measures total debt load relative to company earnings (lower = less debt), while net interest cover measures the ability to pay interest on the debt (higher = greater ability to pay interest costs). Greif is carrying net debt of 4.65 times its EBITDA, which is getting towards the upper limit of our comfort range on a dividend stock that the investor hopes will endure a wide range of economic circumstances.
We calculated its interest cover by measuring its earnings before interest and tax (EBIT), and dividing this by the company's net interest expense. With EBIT of 4.71 times its interest expense, Greif's interest cover is starting to look a bit thin.
We update our data on Greif every 24 hours, so you can always get our latest analysis of its financial health, here.
Dividend Volatility
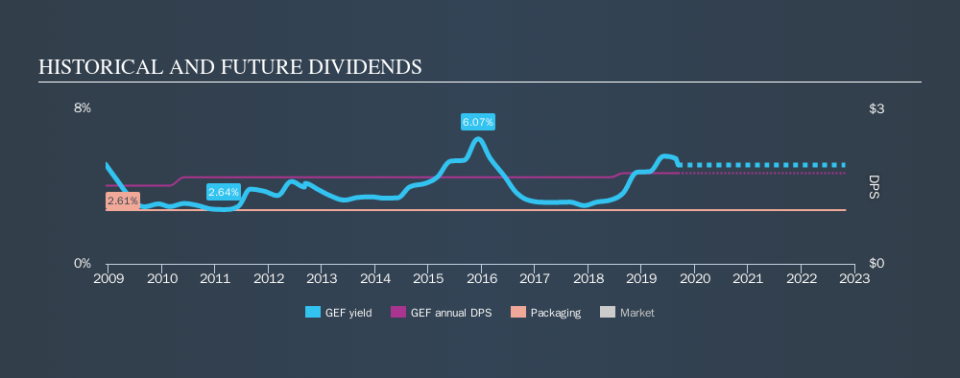
Before buying a stock for its income, we want to see if the dividends have been stable in the past, and if the company has a track record of maintaining its dividend. For the purpose of this article, we only scrutinise the last decade of Greif's dividend payments. During this period the dividend has been stable, which could imply the business could have relatively consistent earnings power. During the past ten-year period, the first annual payment was US$1.52 in 2009, compared to US$1.76 last year. Dividends per share have grown at approximately 1.5% per year over this time.
Dividends have grown relatively slowly, which is not great, but some investors may value the relative consistency of the dividend.
Dividend Growth Potential
Dividend payments have been consistent over the past few years, but we should always check if earnings per share (EPS) are growing, as this will help maintain the purchasing power of the dividend. While there may be fluctuations in the past , Greif's earnings per share have basically not grown from where they were five years ago. Over the long term, steady earnings per share is a risk as the value of the dividends can be reduced by inflation.
Conclusion
When we look at a dividend stock, we need to form a judgement on whether the dividend will grow, if the company is able to maintain it in a wide range of economic circumstances, and if the dividend payout is sustainable. First, we think Greif has an acceptable payout ratio and its dividend is well covered by cashflow. It hasn't demonstrated a strong ability to grow earnings per share, but we like that the dividend payments have been fairly consistent. While we're not hugely bearish on it, overall we think there are potentially better dividend stocks than Greif out there.
Given that earnings are not growing, the dividend does not look nearly so attractive. Businesses can change though, and we think it would make sense to see what analysts are forecasting for the company.
Looking for more high-yielding dividend ideas? Try our curated list of dividend stocks with a yield above 3%.
We aim to bring you long-term focused research analysis driven by fundamental data. Note that our analysis may not factor in the latest price-sensitive company announcements or qualitative material.
If you spot an error that warrants correction, please contact the editor at editorial-team@simplywallst.com. This article by Simply Wall St is general in nature. It does not constitute a recommendation to buy or sell any stock, and does not take account of your objectives, or your financial situation. Simply Wall St has no position in the stocks mentioned. Thank you for reading.
