
 Yahoo Finance
 Greenbrook TMS (TSE:GTMS) adds US$20m to market cap in the past 7 days, though investors from three years ago are still down 80%
This month, we saw the Greenbrook TMS Inc. (TSE:GTMS) up an impressive 70%. But that doesn't change the fact that the returns over the last three years have been stomach churning. Indeed, the share price is down a whopping 80% in the last three years. Arguably, the recent bounce is to be expected after such a bad drop. Only time will tell if the company can sustain the turnaround.
The recent uptick of 34% could be a positive sign of things to come, so let's take a lot at historical fundamentals.
Check out our latest analysis for Greenbrook TMS
Because Greenbrook TMS made a loss in the last twelve months, we think the market is probably more focussed on revenue and revenue growth, at least for now. When a company doesn't make profits, we'd generally expect to see good revenue growth. Some companies are willing to postpone profitability to grow revenue faster, but in that case one does expect good top-line growth.
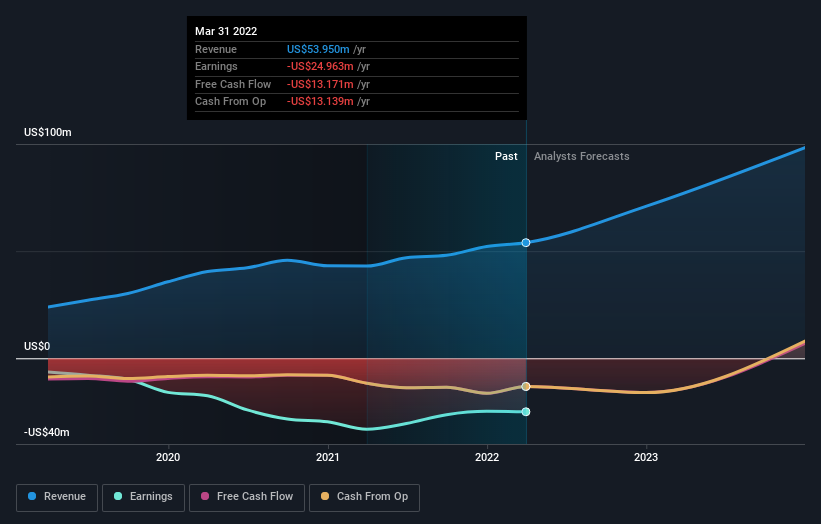
Over three years, Greenbrook TMS grew revenue at 22% per year. That's well above most other pre-profit companies. So on the face of it we're really surprised to see the share price down 22% a year in the same time period. You'd want to take a close look at the balance sheet, as well as the losses. Sometimes fast revenue growth doesn't lead to profits. If the company is low on cash, it may have to raise capital soon.
You can see below how earnings and revenue have changed over time (discover the exact values by clicking on the image).
Balance sheet strength is crucial. It might be well worthwhile taking a look at our free report on how its financial position has changed over time.
A Different Perspective
Over the last year, Greenbrook TMS shareholders took a loss of 79%. In contrast the market gained about 0.8%. However, keep in mind that even the best stocks will sometimes underperform the market over a twelve month period. Shareholders have lost 22% per year over the last three years, so the share price drop has become steeper, over the last year; a potential symptom of as yet unsolved challenges. Although Baron Rothschild famously said to "buy when there's blood in the streets, even if the blood is your own", he also focusses on high quality stocks with solid prospects. I find it very interesting to look at share price over the long term as a proxy for business performance. But to truly gain insight, we need to consider other information, too. To that end, you should learn about the 4 warning signs we've spotted with Greenbrook TMS (including 2 which are a bit concerning) .
But note: Greenbrook TMS may not be the best stock to buy. So take a peek at this free list of interesting companies with past earnings growth (and further growth forecast).
Please note, the market returns quoted in this article reflect the market weighted average returns of stocks that currently trade on CA exchanges.
Have feedback on this article? Concerned about the content? Get in touch with us directly. Alternatively, email editorial-team (at) simplywallst.com.
This article by Simply Wall St is general in nature. We provide commentary based on historical data and analyst forecasts only using an unbiased methodology and our articles are not intended to be financial advice. It does not constitute a recommendation to buy or sell any stock, and does not take account of your objectives, or your financial situation. We aim to bring you long-term focused analysis driven by fundamental data. Note that our analysis may not factor in the latest price-sensitive company announcements or qualitative material. Simply Wall St has no position in any stocks mentioned.
Join A Paid User Research Session
You’ll receive a US$30 Amazon Gift card for 1 hour of your time while helping us build better investing tools for the individual investors like yourself. Sign up here
