
 Yahoo Finance
 Is Great Canadian Gaming Corporation’s (TSE:GC) Balance Sheet A Threat To Its Future?

Small-cap and large-cap companies receive a lot of attention from investors, but mid-cap stocks like Great Canadian Gaming Corporation (TSE:GC), with a market cap of CA$3.29b, are often out of the spotlight. Surprisingly though, when accounted for risk, mid-caps have delivered better returns compared to the two other categories of stocks. Today we will look at GC’s financial liquidity and debt levels, which are strong indicators for whether the company can weather economic downturns or fund strategic acquisitions for future growth. Remember this is a very top-level look that focuses exclusively on financial health, so I recommend a deeper analysis into GC here. See our latest analysis for Great Canadian Gaming
How does GC’s operating cash flow stack up against its debt?
GC’s debt level has been constant at around CA$482.60m over the previous year comprising of short- and long-term debt. At this stable level of debt, GC’s cash and short-term investments stands at CA$322.30m for investing into the business. Additionally, GC has produced CA$192.30m in operating cash flow during the same period of time, leading to an operating cash to total debt ratio of 39.85%, signalling that GC’s current level of operating cash is high enough to cover debt. This ratio can also be a sign of operational efficiency as an alternative to return on assets. In GC’s case, it is able to generate 0.4x cash from its debt capital.
Does GC’s liquid assets cover its short-term commitments?
Looking at GC’s most recent CA$99.00m liabilities, it seems that the business has maintained a safe level of current assets to meet its obligations, with the current ratio last standing at 3.68x. Though, a ratio greater than 3x may be considered as too high, as GC could be holding too much capital in a low-return investment environment.
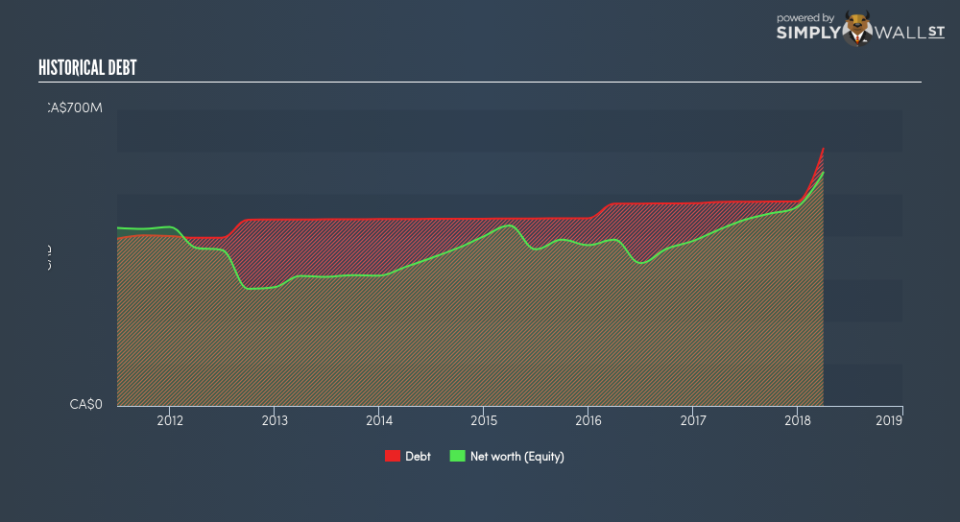
Does GC face the risk of succumbing to its debt-load?
With total debt exceeding equities, GC is considered a highly levered company. This is not uncommon for a mid-cap company given that debt tends to be lower-cost and at times, more accessible. No matter how high the company’s debt, if it can easily cover the interest payments, it’s considered to be efficient with its use of excess leverage. A company generating earnings after interest and tax at least three times its net interest payments is considered financially sound. In GC’s case, the ratio of 5.71x suggests that interest is appropriately covered, which means that lenders may be less hesitant to lend out more funding as GC’s high interest coverage is seen as responsible and safe practice.
Next Steps:
Although GC’s debt level is towards the higher end of the spectrum, its cash flow coverage seems adequate to meet obligations which means its debt is being efficiently utilised. Since there is also no concerns around GC’s liquidity needs, this may be its optimal capital structure for the time being. This is only a rough assessment of financial health, and I’m sure GC has company-specific issues impacting its capital structure decisions. I suggest you continue to research Great Canadian Gaming to get a better picture of the mid-cap by looking at:
Future Outlook: What are well-informed industry analysts predicting for GC’s future growth? Take a look at our free research report of analyst consensus for GC’s outlook.
Valuation: What is GC worth today? Is the stock undervalued, even when its growth outlook is factored into its intrinsic value? The intrinsic value infographic in our free research report helps visualize whether GC is currently mispriced by the market.
Other High-Performing Stocks: Are there other stocks that provide better prospects with proven track records? Explore our free list of these great stocks here.
To help readers see pass the short term volatility of the financial market, we aim to bring you a long-term focused research analysis purely driven by fundamental data. Note that our analysis does not factor in the latest price sensitive company announcements.
The author is an independent contributor and at the time of publication had no position in the stocks mentioned.
