
 Yahoo Finance
 Grange Resources' (ASX:GRR) investors will be pleased with their solid 134% return over the last five years
While Grange Resources Limited (ASX:GRR) shareholders are probably generally happy, the stock hasn't had particularly good run recently, with the share price falling 14% in the last quarter. But at least the stock is up over the last five years. In that time, it is up 38%, which isn't bad, but is below the market return of 46%. While the long term returns are impressive, we do have some sympathy for those who bought more recently, given the 29% drop, in the last year.
With that in mind, it's worth seeing if the company's underlying fundamentals have been the driver of long term performance, or if there are some discrepancies.
Check out our latest analysis for Grange Resources
While markets are a powerful pricing mechanism, share prices reflect investor sentiment, not just underlying business performance. One imperfect but simple way to consider how the market perception of a company has shifted is to compare the change in the earnings per share (EPS) with the share price movement.
During five years of share price growth, Grange Resources achieved compound earnings per share (EPS) growth of 5.8% per year. This EPS growth is reasonably close to the 7% average annual increase in the share price. That suggests that the market sentiment around the company hasn't changed much over that time. Indeed, it would appear the share price is reacting to the EPS.
The company's earnings per share (over time) is depicted in the image below (click to see the exact numbers).
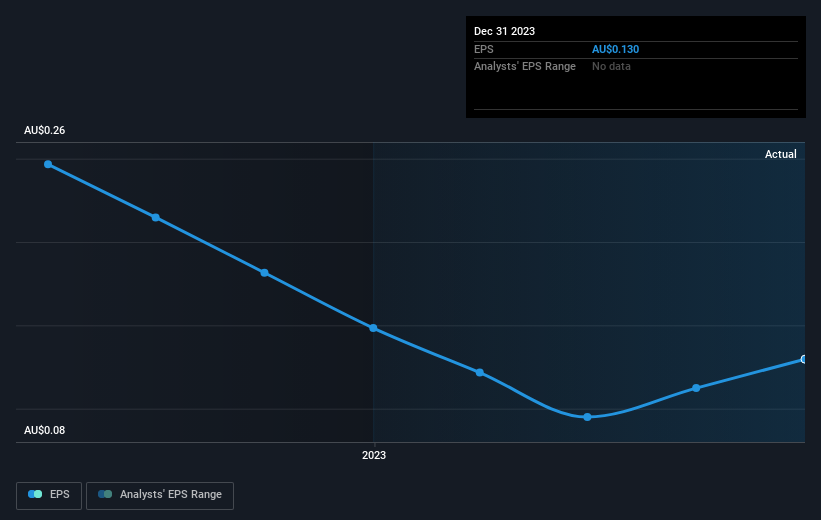
This free interactive report on Grange Resources' earnings, revenue and cash flow is a great place to start, if you want to investigate the stock further.
What About Dividends?
As well as measuring the share price return, investors should also consider the total shareholder return (TSR). The TSR incorporates the value of any spin-offs or discounted capital raisings, along with any dividends, based on the assumption that the dividends are reinvested. So for companies that pay a generous dividend, the TSR is often a lot higher than the share price return. As it happens, Grange Resources' TSR for the last 5 years was 134%, which exceeds the share price return mentioned earlier. The dividends paid by the company have thusly boosted the total shareholder return.
A Different Perspective
Investors in Grange Resources had a tough year, with a total loss of 26% (including dividends), against a market gain of about 13%. Even the share prices of good stocks drop sometimes, but we want to see improvements in the fundamental metrics of a business, before getting too interested. On the bright side, long term shareholders have made money, with a gain of 19% per year over half a decade. If the fundamental data continues to indicate long term sustainable growth, the current sell-off could be an opportunity worth considering. It's always interesting to track share price performance over the longer term. But to understand Grange Resources better, we need to consider many other factors. To that end, you should be aware of the 1 warning sign we've spotted with Grange Resources .
If you are like me, then you will not want to miss this free list of undervalued small caps that insiders are buying.
Please note, the market returns quoted in this article reflect the market weighted average returns of stocks that currently trade on Australian exchanges.
Have feedback on this article? Concerned about the content? Get in touch with us directly. Alternatively, email editorial-team (at) simplywallst.com.
This article by Simply Wall St is general in nature. We provide commentary based on historical data and analyst forecasts only using an unbiased methodology and our articles are not intended to be financial advice. It does not constitute a recommendation to buy or sell any stock, and does not take account of your objectives, or your financial situation. We aim to bring you long-term focused analysis driven by fundamental data. Note that our analysis may not factor in the latest price-sensitive company announcements or qualitative material. Simply Wall St has no position in any stocks mentioned.
Have feedback on this article? Concerned about the content? Get in touch with us directly. Alternatively, email editorial-team@simplywallst.com
