
 Yahoo Finance
 Graham Corporation's (NYSE:GHM) Price Is Right But Growth Is Lacking
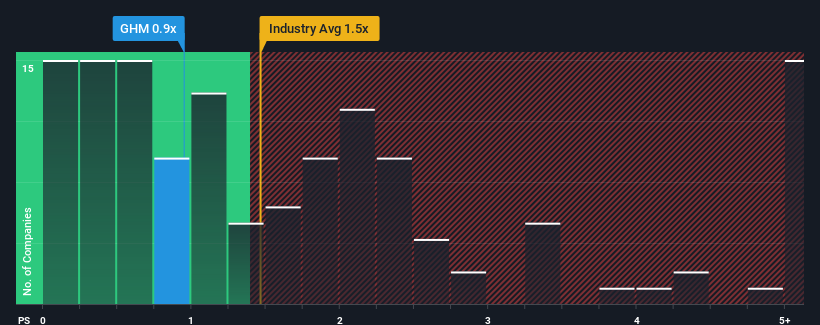
When close to half the companies operating in the Machinery industry in the United States have price-to-sales ratios (or "P/S") above 1.5x, you may consider Graham Corporation (NYSE:GHM) as an attractive investment with its 0.9x P/S ratio. However, the P/S might be low for a reason and it requires further investigation to determine if it's justified.
View our latest analysis for Graham
How Has Graham Performed Recently?
Recent times have been advantageous for Graham as its revenues have been rising faster than most other companies. Perhaps the market is expecting future revenue performance to dive, which has kept the P/S suppressed. If you like the company, you'd be hoping this isn't the case so that you could potentially pick up some stock while it's out of favour.
If you'd like to see what analysts are forecasting going forward, you should check out our free report on Graham.
Do Revenue Forecasts Match The Low P/S Ratio?
Graham's P/S ratio would be typical for a company that's only expected to deliver limited growth, and importantly, perform worse than the industry.
If we review the last year of revenue growth, the company posted a terrific increase of 41%. Pleasingly, revenue has also lifted 69% in aggregate from three years ago, thanks to the last 12 months of growth. Accordingly, shareholders would have definitely welcomed those medium-term rates of revenue growth.
Shifting to the future, estimates from the dual analysts covering the company suggest revenue should grow by 4.5% over the next year. Meanwhile, the rest of the industry is forecast to expand by 6.5%, which is noticeably more attractive.
In light of this, it's understandable that Graham's P/S sits below the majority of other companies. It seems most investors are expecting to see limited future growth and are only willing to pay a reduced amount for the stock.
What Does Graham's P/S Mean For Investors?
Generally, our preference is to limit the use of the price-to-sales ratio to establishing what the market thinks about the overall health of a company.
As we suspected, our examination of Graham's analyst forecasts revealed that its inferior revenue outlook is contributing to its low P/S. Shareholders' pessimism on the revenue prospects for the company seems to be the main contributor to the depressed P/S. The company will need a change of fortune to justify the P/S rising higher in the future.
Many other vital risk factors can be found on the company's balance sheet. Our free balance sheet analysis for Graham with six simple checks will allow you to discover any risks that could be an issue.
It's important to make sure you look for a great company, not just the first idea you come across. So if growing profitability aligns with your idea of a great company, take a peek at this free list of interesting companies with strong recent earnings growth (and a low P/E).
Have feedback on this article? Concerned about the content? Get in touch with us directly. Alternatively, email editorial-team (at) simplywallst.com.
This article by Simply Wall St is general in nature. We provide commentary based on historical data and analyst forecasts only using an unbiased methodology and our articles are not intended to be financial advice. It does not constitute a recommendation to buy or sell any stock, and does not take account of your objectives, or your financial situation. We aim to bring you long-term focused analysis driven by fundamental data. Note that our analysis may not factor in the latest price-sensitive company announcements or qualitative material. Simply Wall St has no position in any stocks mentioned.
Join A Paid User Research Session
You’ll receive a US$30 Amazon Gift card for 1 hour of your time while helping us build better investing tools for the individual investors like yourself. Sign up here
