
 Yahoo Finance
 Grafton Group plc's (LON:GFTU) Stock Is Going Strong: Have Financials A Role To Play?
Grafton Group (LON:GFTU) has had a great run on the share market with its stock up by a significant 12% over the last three months. We wonder if and what role the company's financials play in that price change as a company's long-term fundamentals usually dictate market outcomes. In this article, we decided to focus on Grafton Group's ROE.
Return on Equity or ROE is a test of how effectively a company is growing its value and managing investors’ money. In other words, it is a profitability ratio which measures the rate of return on the capital provided by the company's shareholders.
View our latest analysis for Grafton Group
How Is ROE Calculated?
ROE can be calculated by using the formula:
Return on Equity = Net Profit (from continuing operations) ÷ Shareholders' Equity
So, based on the above formula, the ROE for Grafton Group is:
9.0% = UK£149m ÷ UK£1.7b (Based on the trailing twelve months to December 2023).
The 'return' is the amount earned after tax over the last twelve months. So, this means that for every £1 of its shareholder's investments, the company generates a profit of £0.09.
What Has ROE Got To Do With Earnings Growth?
So far, we've learned that ROE is a measure of a company's profitability. We now need to evaluate how much profit the company reinvests or "retains" for future growth which then gives us an idea about the growth potential of the company. Generally speaking, other things being equal, firms with a high return on equity and profit retention, have a higher growth rate than firms that don’t share these attributes.
Grafton Group's Earnings Growth And 9.0% ROE
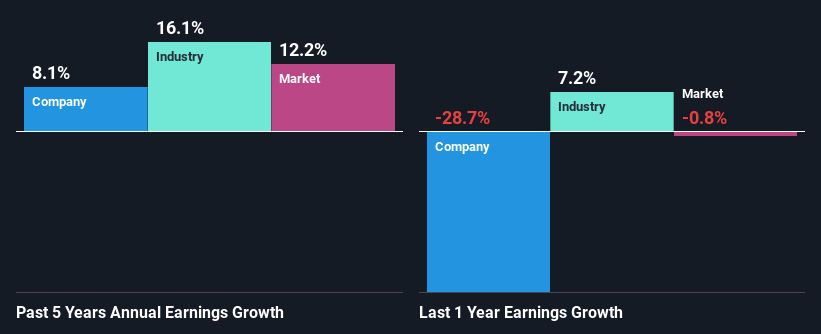
When you first look at it, Grafton Group's ROE doesn't look that attractive. We then compared the company's ROE to the broader industry and were disappointed to see that the ROE is lower than the industry average of 16%. Grafton Group was still able to see a decent net income growth of 8.1% over the past five years. So, the growth in the company's earnings could probably have been caused by other variables. For example, it is possible that the company's management has made some good strategic decisions, or that the company has a low payout ratio.
As a next step, we compared Grafton Group's net income growth with the industry and were disappointed to see that the company's growth is lower than the industry average growth of 16% in the same period.
The basis for attaching value to a company is, to a great extent, tied to its earnings growth. It’s important for an investor to know whether the market has priced in the company's expected earnings growth (or decline). Doing so will help them establish if the stock's future looks promising or ominous. What is GFTU worth today? The intrinsic value infographic in our free research report helps visualize whether GFTU is currently mispriced by the market.
Is Grafton Group Efficiently Re-investing Its Profits?
Grafton Group has a healthy combination of a moderate three-year median payout ratio of 37% (or a retention ratio of 63%) and a respectable amount of growth in earnings as we saw above, meaning that the company has been making efficient use of its profits.
Moreover, Grafton Group is determined to keep sharing its profits with shareholders which we infer from its long history of paying a dividend for at least ten years. Upon studying the latest analysts' consensus data, we found that the company's future payout ratio is expected to rise to 46% over the next three years. However, the company's ROE is not expected to change by much despite the higher expected payout ratio.
Summary
Overall, we feel that Grafton Group certainly does have some positive factors to consider. That is, a decent growth in earnings backed by a high rate of reinvestment. However, we do feel that that earnings growth could have been higher if the business were to improve on the low ROE rate. Especially given how the company is reinvesting a huge chunk of its profits. With that said, the latest industry analyst forecasts reveal that the company's earnings growth is expected to slow down. Are these analysts expectations based on the broad expectations for the industry, or on the company's fundamentals? Click here to be taken to our analyst's forecasts page for the company.
Have feedback on this article? Concerned about the content? Get in touch with us directly. Alternatively, email editorial-team (at) simplywallst.com.
This article by Simply Wall St is general in nature. We provide commentary based on historical data and analyst forecasts only using an unbiased methodology and our articles are not intended to be financial advice. It does not constitute a recommendation to buy or sell any stock, and does not take account of your objectives, or your financial situation. We aim to bring you long-term focused analysis driven by fundamental data. Note that our analysis may not factor in the latest price-sensitive company announcements or qualitative material. Simply Wall St has no position in any stocks mentioned.
