
 Yahoo Finance
 Is GP Strategies Corporation's (NYSE:GPX) Balance Sheet Strong Enough To Weather A Storm?

Want to participate in a short research study? Help shape the future of investing tools and you could win a $250 gift card!
While small-cap stocks, such as GP Strategies Corporation (NYSE:GPX) with its market cap of US$246m, are popular for their explosive growth, investors should also be aware of their balance sheet to judge whether the company can survive a downturn. Assessing first and foremost the financial health is vital, as mismanagement of capital can lead to bankruptcies, which occur at a higher rate for small-caps. We'll look at some basic checks that can form a snapshot the company’s financial strength. However, potential investors would need to take a closer look, and I’d encourage you to dig deeper yourself into GPX here.
GPX’s Debt (And Cash Flows)
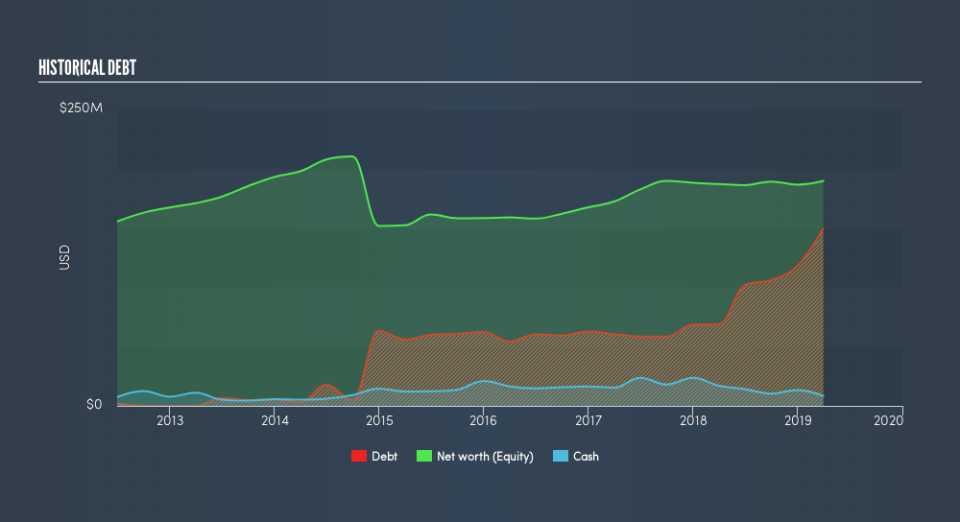
Over the past year, GPX has ramped up its debt from US$69m to US$150m , which accounts for long term debt. With this increase in debt, GPX currently has US$8.4m remaining in cash and short-term investments , ready to be used for running the business. Its negative operating cash flow means calculating cash-to-debt wouldn't be useful. For this article’s sake, I won’t be looking at this today, but you can take a look at some of GPX’s operating efficiency ratios such as ROA here.
Does GPX’s liquid assets cover its short-term commitments?
Looking at GPX’s US$120m in current liabilities, it seems that the business has been able to meet these commitments with a current assets level of US$218m, leading to a 1.83x current account ratio. The current ratio is calculated by dividing current assets by current liabilities. Generally, for Professional Services companies, this is a reasonable ratio since there's a sufficient cash cushion without leaving too much capital idle or in low-earning investments.
Can GPX service its debt comfortably?
GPX is a relatively highly levered company with a debt-to-equity of 61%. This is a bit unusual for a small-cap stock, since they generally have a harder time borrowing than large more established companies. No matter how high the company’s debt, if it can easily cover the interest payments, it’s considered to be efficient with its use of excess leverage. A company generating earnings before interest and tax (EBIT) at least three times its net interest payments is considered financially sound. In GPX's case, the ratio of 4.72x suggests that interest is appropriately covered, which means that debtors may be willing to loan the company more money, giving GPX ample headroom to grow its debt facilities.
Next Steps:
GPX’s high cash coverage means that, although its debt levels are high, the company is able to utilise its borrowings efficiently in order to generate cash flow. Since there is also no concerns around GPX's liquidity needs, this may be its optimal capital structure for the time being. Keep in mind I haven't considered other factors such as how GPX has been performing in the past. I suggest you continue to research GP Strategies to get a better picture of the small-cap by looking at:
Future Outlook: What are well-informed industry analysts predicting for GPX’s future growth? Take a look at our free research report of analyst consensus for GPX’s outlook.
Historical Performance: What has GPX's returns been like over the past? Go into more detail in the past track record analysis and take a look at the free visual representations of our analysis for more clarity.
Other High-Performing Stocks: Are there other stocks that provide better prospects with proven track records? Explore our free list of these great stocks here.
We aim to bring you long-term focused research analysis driven by fundamental data. Note that our analysis may not factor in the latest price-sensitive company announcements or qualitative material.
If you spot an error that warrants correction, please contact the editor at editorial-team@simplywallst.com. This article by Simply Wall St is general in nature. It does not constitute a recommendation to buy or sell any stock, and does not take account of your objectives, or your financial situation. Simply Wall St has no position in the stocks mentioned. Thank you for reading.
