
 Yahoo Finance
 Goodfellow (TSE:GDL) Is Doing The Right Things To Multiply Its Share Price
If you're looking for a multi-bagger, there's a few things to keep an eye out for. Ideally, a business will show two trends; firstly a growing return on capital employed (ROCE) and secondly, an increasing amount of capital employed. This shows us that it's a compounding machine, able to continually reinvest its earnings back into the business and generate higher returns. Speaking of which, we noticed some great changes in Goodfellow's (TSE:GDL) returns on capital, so let's have a look.
What Is Return On Capital Employed (ROCE)?
If you haven't worked with ROCE before, it measures the 'return' (pre-tax profit) a company generates from capital employed in its business. The formula for this calculation on Goodfellow is:
Return on Capital Employed = Earnings Before Interest and Tax (EBIT) ÷ (Total Assets - Current Liabilities)
0.11 = CA$23m ÷ (CA$253m - CA$45m) (Based on the trailing twelve months to November 2023).
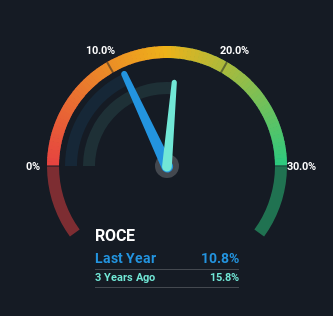
Therefore, Goodfellow has an ROCE of 11%. In isolation, that's a pretty standard return but against the Trade Distributors industry average of 15%, it's not as good.
View our latest analysis for Goodfellow
While the past is not representative of the future, it can be helpful to know how a company has performed historically, which is why we have this chart above. If you'd like to look at how Goodfellow has performed in the past in other metrics, you can view this free graph of Goodfellow's past earnings, revenue and cash flow.
What Can We Tell From Goodfellow's ROCE Trend?
Goodfellow is displaying some positive trends. The numbers show that in the last five years, the returns generated on capital employed have grown considerably to 11%. The company is effectively making more money per dollar of capital used, and it's worth noting that the amount of capital has increased too, by 76%. So we're very much inspired by what we're seeing at Goodfellow thanks to its ability to profitably reinvest capital.
One more thing to note, Goodfellow has decreased current liabilities to 18% of total assets over this period, which effectively reduces the amount of funding from suppliers or short-term creditors. So shareholders would be pleased that the growth in returns has mostly come from underlying business performance.
The Bottom Line On Goodfellow's ROCE
A company that is growing its returns on capital and can consistently reinvest in itself is a highly sought after trait, and that's what Goodfellow has. And with the stock having performed exceptionally well over the last five years, these patterns are being accounted for by investors. Therefore, we think it would be worth your time to check if these trends are going to continue.
If you'd like to know about the risks facing Goodfellow, we've discovered 3 warning signs that you should be aware of.
While Goodfellow isn't earning the highest return, check out this free list of companies that are earning high returns on equity with solid balance sheets.
Have feedback on this article? Concerned about the content? Get in touch with us directly. Alternatively, email editorial-team (at) simplywallst.com.
This article by Simply Wall St is general in nature. We provide commentary based on historical data and analyst forecasts only using an unbiased methodology and our articles are not intended to be financial advice. It does not constitute a recommendation to buy or sell any stock, and does not take account of your objectives, or your financial situation. We aim to bring you long-term focused analysis driven by fundamental data. Note that our analysis may not factor in the latest price-sensitive company announcements or qualitative material. Simply Wall St has no position in any stocks mentioned.
