
 Yahoo Finance
 Goldmoney's (TSE:XAU) Shareholders Are Down 44% On Their Shares
Ideally, your overall portfolio should beat the market average. But in any portfolio, there will be mixed results between individual stocks. At this point some shareholders may be questioning their investment in Goldmoney Inc. (TSE:XAU), since the last five years saw the share price fall 44%. Furthermore, it's down 19% in about a quarter. That's not much fun for holders.
See our latest analysis for Goldmoney
There is no denying that markets are sometimes efficient, but prices do not always reflect underlying business performance. One way to examine how market sentiment has changed over time is to look at the interaction between a company's share price and its earnings per share (EPS).
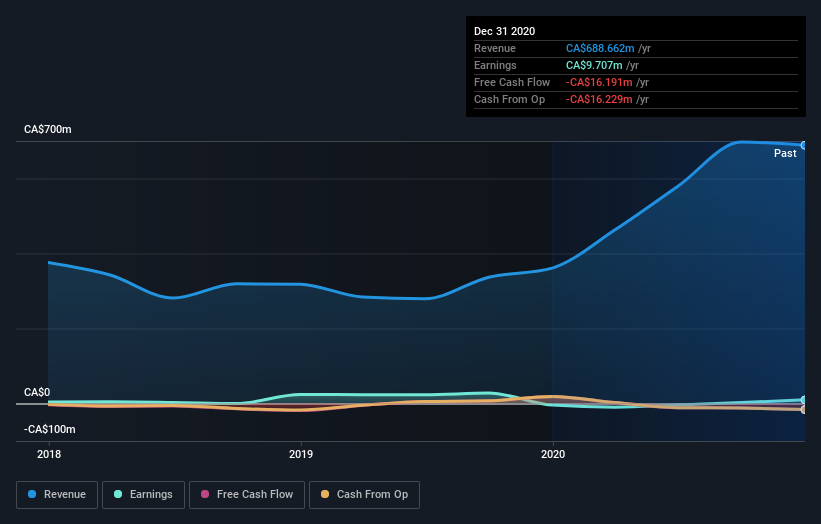
During five years of share price growth, Goldmoney moved from a loss to profitability. Most would consider that to be a good thing, so it's counter-intuitive to see the share price declining. Other metrics may better explain the share price move.
We don't think that the 0.6% is big factor in the share price, since it's quite small, as dividends go. In contrast to the share price, revenue has actually increased by 9.8% a year in the five year period. So it seems one might have to take closer look at the fundamentals to understand why the share price languishes. After all, there may be an opportunity.
The image below shows how earnings and revenue have tracked over time (if you click on the image you can see greater detail).
Take a more thorough look at Goldmoney's financial health with this free report on its balance sheet.
A Different Perspective
Goldmoney shareholders gained a total return of 13% during the year. But that was short of the market average. On the bright side, that's still a gain, and it is certainly better than the yearly loss of about 7% endured over half a decade. It could well be that the business is stabilizing. While it is well worth considering the different impacts that market conditions can have on the share price, there are other factors that are even more important. To that end, you should be aware of the 2 warning signs we've spotted with Goldmoney .
But note: Goldmoney may not be the best stock to buy. So take a peek at this free list of interesting companies with past earnings growth (and further growth forecast).
Please note, the market returns quoted in this article reflect the market weighted average returns of stocks that currently trade on CA exchanges.
This article by Simply Wall St is general in nature. It does not constitute a recommendation to buy or sell any stock, and does not take account of your objectives, or your financial situation. We aim to bring you long-term focused analysis driven by fundamental data. Note that our analysis may not factor in the latest price-sensitive company announcements or qualitative material. Simply Wall St has no position in any stocks mentioned.
Have feedback on this article? Concerned about the content? Get in touch with us directly. Alternatively, email editorial-team (at) simplywallst.com.
