
 Yahoo Finance
 Gold Price Futures (GC) Technical Analysis – Trend Down, but Buyers Trying to Form Secondary Higher Bottom
April Comex Gold futures settled slightly lower on Friday and for the week as investors continued to react to the uncertainty over the number of Fed rate hikes in 2018 and a firmer U.S. Dollar.
At 2135 GMT, April Comex Gold futures are trading $1330.90, down $1.90 or -0.14%.
Gold is currently in a position to post its biggest weekly decline in 2 ½ months on the back of higher U.S. Treasury yields. Rising U.S. yields have put the dollar on track for its second biggest weekly gain of the year.
Daily Technical Analysis
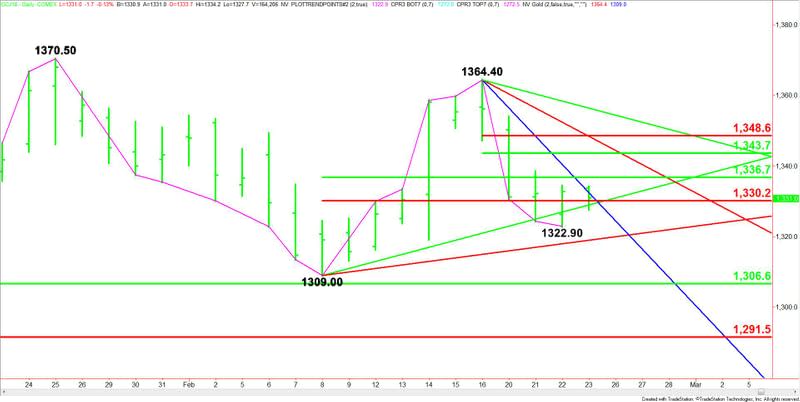
The main trend is down according to the daily swing chart. A trade through $1364.40 will change the main trend to up.
A move through $1322.90 will indicate the selling is getting stronger while a trade through $1309.00 will signal a resumption of the downtrend.
The major support is the retracement zone at $1306.60 to $1291.50.
The intermediate range is $1309.00 to $1364.40. Gold is currently straddling its retracement zone at $1336.70 to $1330.20. This zone is acting like a pivot. Buyers are trying to establish a secondary higher bottom inside this zone.
The short-term range is $1364.40 to $1322.90. If buyers can overcome the intermediate retracement zone then we could see a move into the short-term retracement zone at $1343.70 to $1348.60. Since the main trend is down, sellers may come in on a test of this zone.
Daily Technical Forecast
On Friday, gold straddled a downtrending Gann angle at $1332.40, a Fibonacci level at $1330.20 and an uptrending Gann angle at $1329.10. This chart pattern tends to indicate investor indecision and impending volatility.
The daily chart suggests that investors should start looking for an upside bias to develop on a sustained move over $1332.40 and for a downside bias to develop on a sustained move under $1329.10.
This article was originally posted on FX Empire
