
 Yahoo Finance
 Gold Bounce May Be Fizzling, SPX 500 Threatens Key Trend Support
DailyFX.com -
Talking Points:
US Dollar Selloff Stalls After Prices Dropped to 3-Week Low
S&P 500 Drops Anew, Threatens Long-Term Trend Support
Gold Rebound Shows Tentative Signs of Ebbing Momentum
Can’t access the Dow Jones FXCM US Dollar Index? Try the USD basket on Mirror Trader. **
US DOLLAR TECHNICAL ANALYSIS – Prices corrected downward as expected after prices produced a bearish Dark Cloud Cover candlestick pattern. Near-term support is at 10942, the 38.2% Fibonacci retracement, with a break below that on a daily closing basis exposing the 50% level at 10880. Alternatively, a reversal above the 23.6% Fib at 11019 opens the door for a challenge of the 14.6% retracement at 11066.
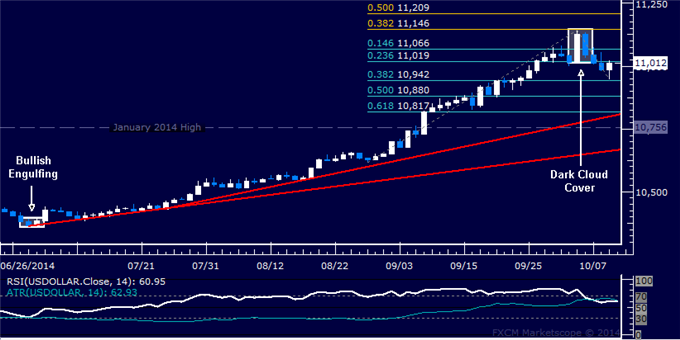
Daily Chart - Created Using FXCM Marketscope 2.0
** The Dow Jones FXCM US Dollar Index and the Mirror Trader USD basket are not the same product.
S&P 500 TECHNICAL ANALYSIS – Prices turned lower anew to test support in the 1918.30-25.10 area marked by a rising channel floor guiding the uptrend since mid-2013 and the October 2 swing low. A break below that on a daily closing basis exposes resistance-turned-support at 1899.10, the April 4 high.

Daily Chart - Created Using FXCM Marketscope 2.0
GOLD TECHNICAL ANALYSIS – Prices advanced as expected after putting in a bullish Piercing Line candlestick pattern. A continued push higher through the 38.2% Fibonacci retracement at 1236.31 exposes the 50% level at 1252.80. However, the appearance of a Shooting Star candles warns a pullback may be ahead. A turn below the 23.6% level at 1215.91 targets the intersection of falling channel top resistance-turned-support and the 14.6% Fib at 1203.33.
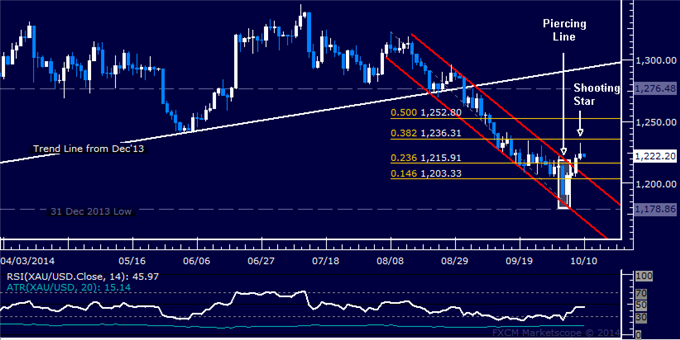
Daily Chart - Created Using FXCM Marketscope 2.0
CRUDE OIL TECHNICAL ANALYSIS – Prices are testing support at 87.73, the 50% Fibonacci expansion. A break below that exposes the 61.8% level at 85.36. Alternatively, a reversal above the intersection of channel floor support-turned-resistance and the 38.2% Fib at 90.11 aims for the 23.6% expansion at 93.04.

Daily Chart - Created Using FXCM Marketscope 2.0
--- Written by Ilya Spivak, Currency Strategist for DailyFX.com
To receive Ilya's analysis directly via email, please SIGN UP HERE
Contact and follow Ilya on Twitter: @IlyaSpivak
DailyFX provides forex news and technical analysis on the trends that influence the global currency markets.
Learn forex trading with a free practice account and trading charts from FXCM.
