
 Yahoo Finance
 GMS (NYSE:GMS) sheds 5.7% this week, as yearly returns fall more in line with earnings growth
We think all investors should try to buy and hold high quality multi-year winners. And we've seen some truly amazing gains over the years. For example, the GMS Inc. (NYSE:GMS) share price is up a whopping 447% in the last half decade, a handsome return for long term holders. And this is just one example of the epic gains achieved by some long term investors. On top of that, the share price is up 18% in about a quarter.
In light of the stock dropping 5.7% in the past week, we want to investigate the longer term story, and see if fundamentals have been the driver of the company's positive five-year return.
Check out our latest analysis for GMS
In his essay The Superinvestors of Graham-and-Doddsville Warren Buffett described how share prices do not always rationally reflect the value of a business. One imperfect but simple way to consider how the market perception of a company has shifted is to compare the change in the earnings per share (EPS) with the share price movement.
Over half a decade, GMS managed to grow its earnings per share at 44% a year. This EPS growth is reasonably close to the 40% average annual increase in the share price. Therefore one could conclude that sentiment towards the shares hasn't morphed very much. Indeed, it would appear the share price is reacting to the EPS.
You can see how EPS has changed over time in the image below (click on the chart to see the exact values).
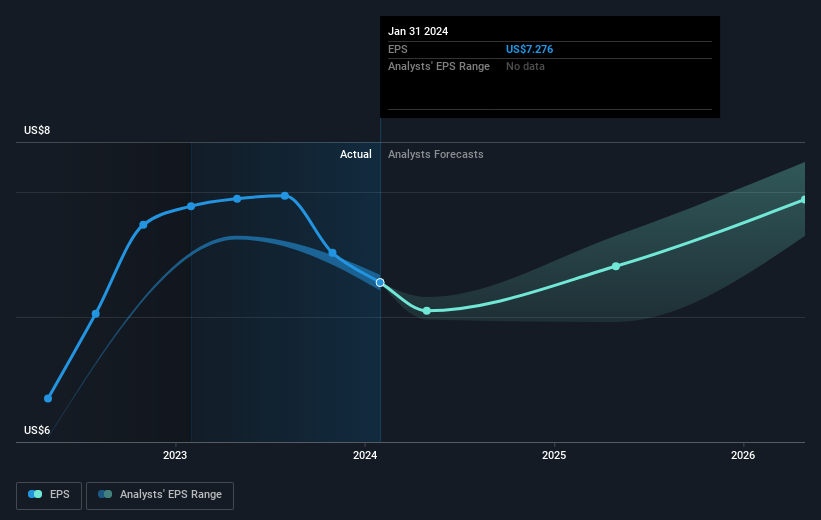
It is of course excellent to see how GMS has grown profits over the years, but the future is more important for shareholders. It might be well worthwhile taking a look at our free report on how its financial position has changed over time.
A Different Perspective
It's nice to see that GMS shareholders have received a total shareholder return of 68% over the last year. Since the one-year TSR is better than the five-year TSR (the latter coming in at 40% per year), it would seem that the stock's performance has improved in recent times. Someone with an optimistic perspective could view the recent improvement in TSR as indicating that the business itself is getting better with time. It's always interesting to track share price performance over the longer term. But to understand GMS better, we need to consider many other factors. To that end, you should be aware of the 2 warning signs we've spotted with GMS .
If you are like me, then you will not want to miss this free list of growing companies that insiders are buying.
Please note, the market returns quoted in this article reflect the market weighted average returns of stocks that currently trade on American exchanges.
Have feedback on this article? Concerned about the content? Get in touch with us directly. Alternatively, email editorial-team (at) simplywallst.com.
This article by Simply Wall St is general in nature. We provide commentary based on historical data and analyst forecasts only using an unbiased methodology and our articles are not intended to be financial advice. It does not constitute a recommendation to buy or sell any stock, and does not take account of your objectives, or your financial situation. We aim to bring you long-term focused analysis driven by fundamental data. Note that our analysis may not factor in the latest price-sensitive company announcements or qualitative material. Simply Wall St has no position in any stocks mentioned.
