
 Yahoo Finance
 Gentex's (NASDAQ:GNTX) five-year earnings growth trails the 12% YoY shareholder returns
The main point of investing for the long term is to make money. But more than that, you probably want to see it rise more than the market average. Unfortunately for shareholders, while the Gentex Corporation (NASDAQ:GNTX) share price is up 61% in the last five years, that's less than the market return. The last year has been disappointing, with the stock price down 12% in that time.
The past week has proven to be lucrative for Gentex investors, so let's see if fundamentals drove the company's five-year performance.
View our latest analysis for Gentex
To paraphrase Benjamin Graham: Over the short term the market is a voting machine, but over the long term it's a weighing machine. One way to examine how market sentiment has changed over time is to look at the interaction between a company's share price and its earnings per share (EPS).
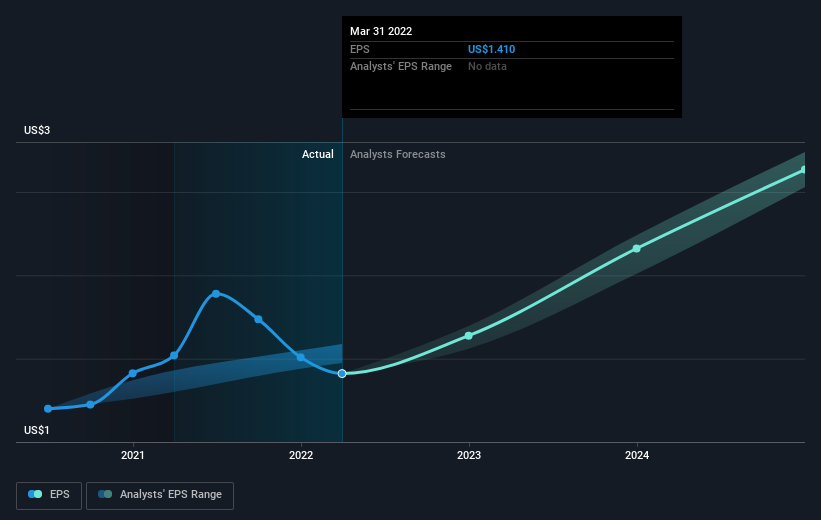
During five years of share price growth, Gentex achieved compound earnings per share (EPS) growth of 2.1% per year. This EPS growth is slower than the share price growth of 10% per year, over the same period. So it's fair to assume the market has a higher opinion of the business than it did five years ago. That's not necessarily surprising considering the five-year track record of earnings growth.
The graphic below depicts how EPS has changed over time (unveil the exact values by clicking on the image).
We're pleased to report that the CEO is remunerated more modestly than most CEOs at similarly capitalized companies. It's always worth keeping an eye on CEO pay, but a more important question is whether the company will grow earnings throughout the years. It might be well worthwhile taking a look at our free report on Gentex's earnings, revenue and cash flow.
What About Dividends?
As well as measuring the share price return, investors should also consider the total shareholder return (TSR). Whereas the share price return only reflects the change in the share price, the TSR includes the value of dividends (assuming they were reinvested) and the benefit of any discounted capital raising or spin-off. It's fair to say that the TSR gives a more complete picture for stocks that pay a dividend. As it happens, Gentex's TSR for the last 5 years was 76%, which exceeds the share price return mentioned earlier. The dividends paid by the company have thusly boosted the total shareholder return.
A Different Perspective
We regret to report that Gentex shareholders are down 10% for the year (even including dividends). Unfortunately, that's worse than the broader market decline of 6.6%. However, it could simply be that the share price has been impacted by broader market jitters. It might be worth keeping an eye on the fundamentals, in case there's a good opportunity. Longer term investors wouldn't be so upset, since they would have made 12%, each year, over five years. If the fundamental data continues to indicate long term sustainable growth, the current sell-off could be an opportunity worth considering. If you would like to research Gentex in more detail then you might want to take a look at whether insiders have been buying or selling shares in the company.
If you would prefer to check out another company -- one with potentially superior financials -- then do not miss this free list of companies that have proven they can grow earnings.
Please note, the market returns quoted in this article reflect the market weighted average returns of stocks that currently trade on US exchanges.
Have feedback on this article? Concerned about the content? Get in touch with us directly. Alternatively, email editorial-team (at) simplywallst.com.
This article by Simply Wall St is general in nature. We provide commentary based on historical data and analyst forecasts only using an unbiased methodology and our articles are not intended to be financial advice. It does not constitute a recommendation to buy or sell any stock, and does not take account of your objectives, or your financial situation. We aim to bring you long-term focused analysis driven by fundamental data. Note that our analysis may not factor in the latest price-sensitive company announcements or qualitative material. Simply Wall St has no position in any stocks mentioned.
