
 Yahoo Finance
 GBP/USD Daily Forecast – Pound Tumbles, Flirting With 1.2400 Handle
GBP/USD Close to Breaking to a 28-Month Low
If it wasn’t for a brief spike lower on January 3rd, GBP/USD would already be trading at multi-year lows. Perhaps this is distorting the measurement, but make no mistake, The British pound is notably weak.
The early year spike down holds a low of 1.2373 on my chart. That is about 10 pip lower from where the pair traded earlier today. A break below it would have the exchange rate trading at levels not seen since March 2017.
UK Inflation Rises as Expected
The Office for National Statistics reported a 2% rise in the Consumer Price Index in the year to June. This was as expected and unchanged from the prior reading. Core CPI rose 1.8% during the same time, also as expected.
In addition to CPI, PPI input fell short in June declining 1.4%. Output also missed the forecast with a decline of 0.1%. The House Price Index rose 1.2% on an annual basis, which was expected.
Technical Analysis
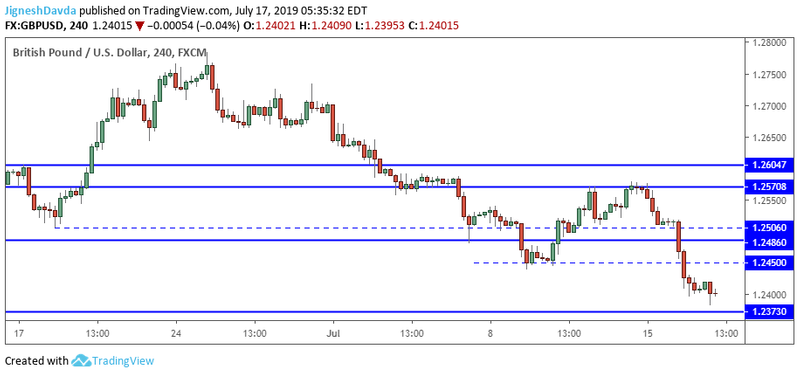
There is certainly a lot of momentum behind the decline in GBP/USD.
I think it will take a rally above 1.2450 for this downside momentum to subside a bit. While below the level, there is potential for a continuation. The mentioned level had held the exchange rate higher last week, triggering a recovery to test resistance at 1.2570.
The next level of support I have is at 1.2373 which marks this years low. There may be some stops below the level from traders that positioned long last week, hoping for a bigger swing. In this context, I do think we can at least spike below the level if we test it.
Bottom Line
GBP/USD has been declining with momentum. It will take a rally above 1.2450 to cool down the momentum
Lows set at the start of the year fall at 1.2373. if GBP/USD breaks below it, it will be trading at levels not seen since March 2017.
It’s worth keeping an eye on the US dollar index (DXY) here. It is coming into levels that have acted as major resistance in the past.
This article was originally posted on FX Empire
More From FXEMPIRE:
U.S. Dollar Index Futures (DX) Technical Analysis – July 18, 2019 Forecast
GBP/JPY Price Forecast – British pound recovers slightly against Japanese yen
Natural Gas Price Forecast – Natural gas markets show support just below
E-mini S&P 500 Index (ES) Futures Technical Analysis – July 18, 2019 Forecast
