
 Yahoo Finance
 Gap's (NYSE:GPS) Dividend Will Be $0.15
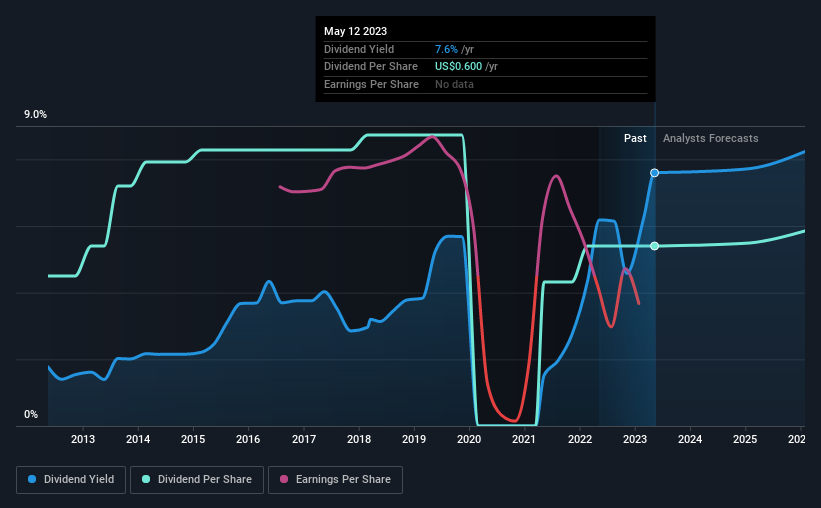
The Gap, Inc.'s (NYSE:GPS) investors are due to receive a payment of $0.15 per share on 26th of July. This means the annual payment is 7.6% of the current stock price, which is above the average for the industry.
While the dividend yield is important for income investors, it is also important to consider any large share price moves, as this will generally outweigh any gains from distributions. Gap's stock price has reduced by 41% in the last 3 months, which is not ideal for investors and can explain a sharp increase in the dividend yield.
Check out our latest analysis for Gap
Gap Is Paying Out More Than It Is Earning
A big dividend yield for a few years doesn't mean much if it can't be sustained. Despite not generating a profit, Gap is still paying a dividend. Along with this, it is also not generating free cash flows, which raises concerns about the sustainability of the dividend.
The next 12 months is set to see EPS grow by 181.3%. Assuming the dividend continues along recent trends, we think the payout ratio could reach 114%, which probably can't continue without putting some pressure on the balance sheet.
Dividend Volatility
The company's dividend history has been marked by instability, with at least one cut in the last 10 years. The dividend has gone from an annual total of $0.50 in 2013 to the most recent total annual payment of $0.60. This works out to be a compound annual growth rate (CAGR) of approximately 1.8% a year over that time. We're glad to see the dividend has risen, but with a limited rate of growth and fluctuations in the payments the total shareholder return may be limited.
The Dividend Has Limited Growth Potential
Given that the dividend has been cut in the past, we need to check if earnings are growing and if that might lead to stronger dividends in the future. Over the past five years, it looks as though Gap's EPS has declined at around 36% a year. Dividend payments are likely to come under some pressure unless EPS can pull out of the nosedive it is in. It's not all bad news though, as the earnings are predicted to rise over the next 12 months - we would just be a bit cautious until this becomes a long term trend.
We're Not Big Fans Of Gap's Dividend
Overall, while some might be pleased that the dividend wasn't cut, we think this may help Gap make more consistent payments in the future. The company seems to be stretching itself a bit to make such big payments, but it doesn't appear they can be consistent over time. Overall, this doesn't get us very excited from an income standpoint.
Investors generally tend to favour companies with a consistent, stable dividend policy as opposed to those operating an irregular one. At the same time, there are other factors our readers should be conscious of before pouring capital into a stock. For example, we've picked out 1 warning sign for Gap that investors should know about before committing capital to this stock. Looking for more high-yielding dividend ideas? Try our collection of strong dividend payers.
Have feedback on this article? Concerned about the content? Get in touch with us directly. Alternatively, email editorial-team (at) simplywallst.com.
This article by Simply Wall St is general in nature. We provide commentary based on historical data and analyst forecasts only using an unbiased methodology and our articles are not intended to be financial advice. It does not constitute a recommendation to buy or sell any stock, and does not take account of your objectives, or your financial situation. We aim to bring you long-term focused analysis driven by fundamental data. Note that our analysis may not factor in the latest price-sensitive company announcements or qualitative material. Simply Wall St has no position in any stocks mentioned.
Join A Paid User Research Session
You’ll receive a US$30 Amazon Gift card for 1 hour of your time while helping us build better investing tools for the individual investors like yourself. Sign up here
