
 Yahoo Finance
 Gap (NYSE:GPS) shareholders have earned a 134% return over the last year
The Gap, Inc. (NYSE:GPS) shareholders might be concerned after seeing the share price drop 25% in the last month. But that doesn't detract from the splendid returns of the last year. We're very pleased to report the share price shot up 124% in that time. So it is important to view the recent reduction in price through that lense. Only time will tell if there is still too much optimism currently reflected in the share price.
With that in mind, it's worth seeing if the company's underlying fundamentals have been the driver of long term performance, or if there are some discrepancies.
View our latest analysis for Gap
To quote Buffett, 'Ships will sail around the world but the Flat Earth Society will flourish. There will continue to be wide discrepancies between price and value in the marketplace...' One imperfect but simple way to consider how the market perception of a company has shifted is to compare the change in the earnings per share (EPS) with the share price movement.
Gap went from making a loss to reporting a profit, in the last year.
When a company has just transitioned to profitability, earnings per share growth is not always the best way to look at the share price action.
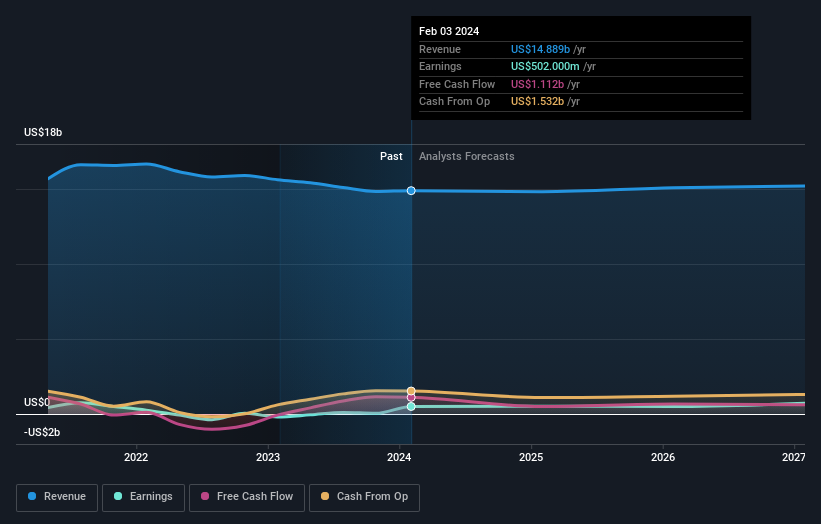
Gap's revenue actually dropped 4.6% over last year. So using a snapshot of key business metrics doesn't give us a good picture of why the market is bidding up the stock.
The image below shows how earnings and revenue have tracked over time (if you click on the image you can see greater detail).
Gap is a well known stock, with plenty of analyst coverage, suggesting some visibility into future growth. So we recommend checking out this free report showing consensus forecasts
What About Dividends?
As well as measuring the share price return, investors should also consider the total shareholder return (TSR). The TSR is a return calculation that accounts for the value of cash dividends (assuming that any dividend received was reinvested) and the calculated value of any discounted capital raisings and spin-offs. So for companies that pay a generous dividend, the TSR is often a lot higher than the share price return. As it happens, Gap's TSR for the last 1 year was 134%, which exceeds the share price return mentioned earlier. And there's no prize for guessing that the dividend payments largely explain the divergence!
A Different Perspective
It's nice to see that Gap shareholders have received a total shareholder return of 134% over the last year. That's including the dividend. Notably the five-year annualised TSR loss of 0.5% per year compares very unfavourably with the recent share price performance. We generally put more weight on the long term performance over the short term, but the recent improvement could hint at a (positive) inflection point within the business. It's always interesting to track share price performance over the longer term. But to understand Gap better, we need to consider many other factors. For instance, we've identified 1 warning sign for Gap that you should be aware of.
If you like to buy stocks alongside management, then you might just love this free list of companies. (Hint: insiders have been buying them).
Please note, the market returns quoted in this article reflect the market weighted average returns of stocks that currently trade on American exchanges.
Have feedback on this article? Concerned about the content? Get in touch with us directly. Alternatively, email editorial-team (at) simplywallst.com.
This article by Simply Wall St is general in nature. We provide commentary based on historical data and analyst forecasts only using an unbiased methodology and our articles are not intended to be financial advice. It does not constitute a recommendation to buy or sell any stock, and does not take account of your objectives, or your financial situation. We aim to bring you long-term focused analysis driven by fundamental data. Note that our analysis may not factor in the latest price-sensitive company announcements or qualitative material. Simply Wall St has no position in any stocks mentioned.
