
 Yahoo Finance
 Fundamentals + Technicals: The Magic Elixir
When it comes to stock market analysis, there are a plethora of ways to “skin the cat”. Some investors make decisions based on specific catalysts, sentiment, or even the time of year. The two most common ways to analyze markets are technical analysis and fundamental analysis.
Technicians utilize price action, volume, patterns, and indicators to give them insight into potential market outcomes. Alternatively, fundamental investors examine the company’s income statement, industry trends, management quality, and intrinsic value to determine the company’s prospects. In both technical and fundamental analysis, different sects exist. Today we will put on a “techno-fundamental” lens and identify stocks with explosive earnings growth and expectations and strong technical momentum and patterns:
Impinj PI is a semiconductor leader best known for itsRFID (Radio Frequency Identification Device). An RFID is a small and inexpensive chip, used to track items. Impinj’s technology is used by a growing number of large companies like
· Macy’s Mto track merchandise.
· Delta Airlines DAL to limit the amount of misplaced or stolen luggage.
· Volvo to ensure accuracy in its automobile manufacturing process.
That’s to name a few. RFID technology is growing like a weed, and adoption is merely in its infancy.
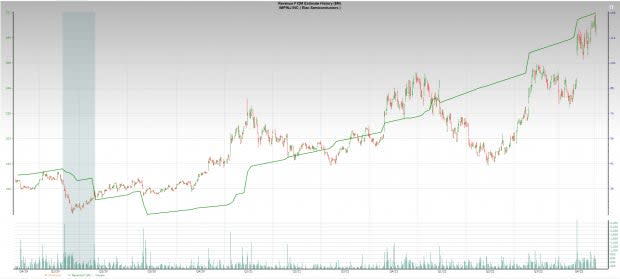
Image Source: Zacks Investment Research
Pictured: PI's revenue growth history (green line).
Pi holds a robust Zack’s Ranking of 2, and consensus estimates suggest continued revenue growth for 2023. Impinj’s revenue was up 50% last quarter, while EPS swung from 0.25 in 2021 to .90 this year.
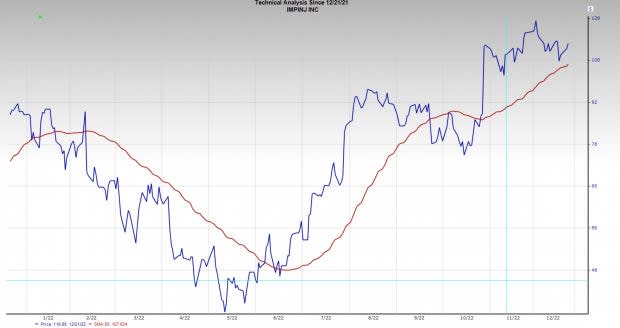
Image Source: Zacks Investment Research
Pictured: PI is in a favorable risk/reward zone against its rising 50-day moving average.
From a technical perspective, PI is drastically outperforming the general market (PI is +120.3% over the past six months versus +1.4% for the S&P 500). On October 27, the stock spiked 29% on volume six times the norm – a sign of heavy accumulation. Since then, the stock has been digesting gains and consolidation.
View:The stock provides prospective investors with an appealing area of risk/reward versus its 50-day moving average.
Super Micro Computer Inc SMCI designs, develops, and manufactures high-performance, energy-efficient servers. Last quarter’s results are proof that its commercial servers are a hit. SMCI grew EPS by 490% on revenue which grew at 79%. The outstanding quarter marked the third straight quarter of triple-digit EPS growth. SMCI holds a best possible Zack’s Ranking of 1.
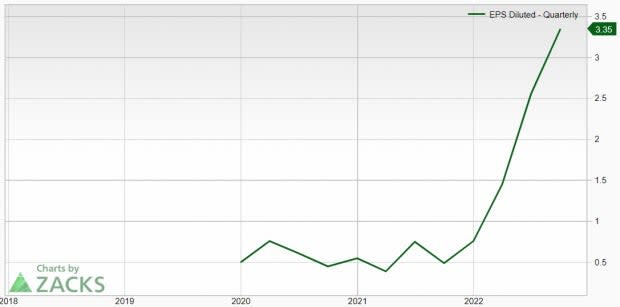
Image Source: Zacks Investment Research
Pictured: SMCI sports one of the highest EPS growth rates in the market.
With the growth and price momentum SMCI’s stock is experiencing, one would think that the valuation is lofty. Surprisingly, SMCI has a P/E of just 10.33, well under that of the S&P 500 which sits at 17.66.
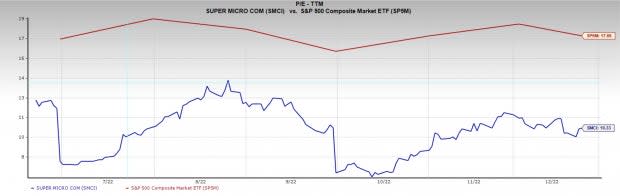
Image Source: Zacks Investment Research
Pictured: SMCI's P/E is below the S&P 500's.
SMCI completely ignored the bear market in tech in 2022 and trended higher all year, far outpacing peers. The stock got initial support off its rising 50-day moving average after news broke that the company would be added to the S&P 400 Midcap Index.
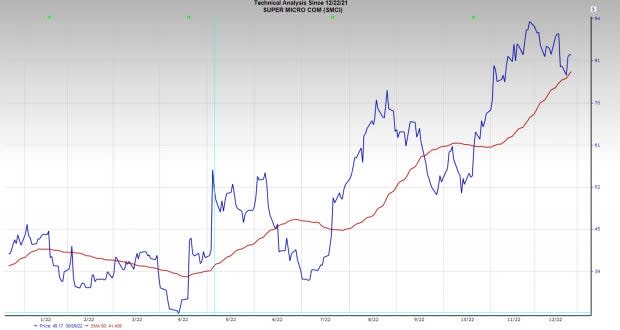
Image Source: Zacks Investment Research
Pictured: SMCI recently got support at its 50-day moving average after being added to the S&P 400 Midcap Index.
View: SMCI’s performance from both a technical and fundamental perspective suggests that if U.S. equities are to steady themselves or trend higher over the few months, SMCI should continue to assert itself as a market leader.
Halliburton HAL is one of the largest oilfield service providers in the world, offering a variety of equipment, maintenance, and construction services to the energy sector. While Halliburton’s business may not be as “sexy” as Impinj’s or Super Micro Computer’s, there is something to be said for being in the right place at the right time. The Oil – and Gas – Field Services group is ranked in the top 6% of all industries tracked by Zack’s. Meanwhile, Halliburton holds a best possible Zack’s Ranking of 1.
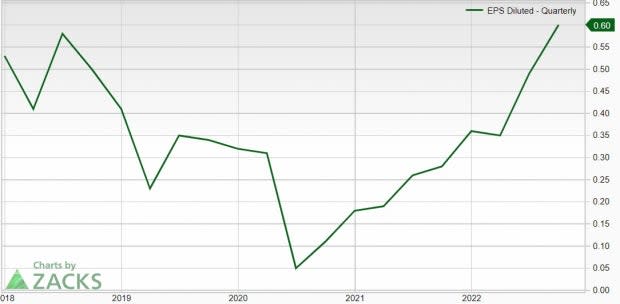
Image Source: Zacks Investment Research
Pictured: Halliburton's impressive EPS growth turnaround.
Since the Covid crash, HAL’s EPS has been on an impressive growth trajectory. Over the past three quarters, EPS has grown 114%, 88%, and 84%, with double-digit revenue growth to match. If the price of oil stays elevated, Halliburton should outperform. There is good reason to think that may happen. After digesting its massive gains over the past few months and pulling back, crude oil has drastically outperformed equities in the past two weeks as energy has led the market. This type of relative strength is often a tip-off that more strength is on the way.
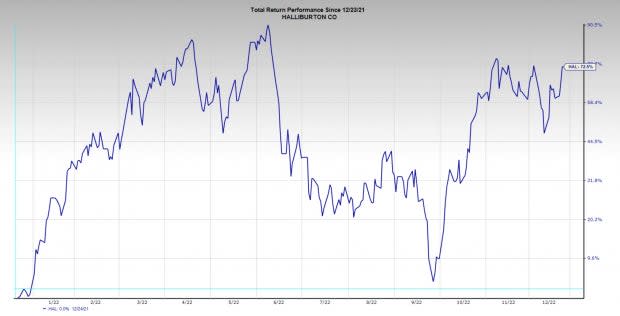
Image Source: Zacks Investment Research
Pictured: HAL sets up in a bullish chart pattern.
View:Though oil is well off its highs, HAL’s stock has recovered and is now forming a cup with handle pattern – a bullish sign. If the stock can decisively clear resistance at $40 in the next few weeks, it will likely to resume its bullish uptrend and outperform.
Want the latest recommendations from Zacks Investment Research? Today, you can download 7 Best Stocks for the Next 30 Days. Click to get this free report
Halliburton Company (HAL) : Free Stock Analysis Report
Delta Air Lines, Inc. (DAL) : Free Stock Analysis Report
Macy's, Inc. (M) : Free Stock Analysis Report
Super Micro Computer, Inc. (SMCI) : Free Stock Analysis Report
Impinj, Inc. (PI) : Free Stock Analysis Report
