
 Yahoo Finance
 Is FRIWO AG’s (FRA:CEA) 21% ROCE Any Good?

Today we’ll look at FRIWO AG (FRA:CEA) and reflect on its potential as an investment. Specifically, we’re going to calculate its Return On Capital Employed (ROCE), in the hopes of getting some insight into the business.
First of all, we’ll work out how to calculate ROCE. Next, we’ll compare it to others in its industry. Then we’ll determine how its current liabilities are affecting its ROCE.
Return On Capital Employed (ROCE): What is it?
ROCE measures the amount of pre-tax profits a company can generate from the capital employed in its business. In general, businesses with a higher ROCE are usually better quality. Overall, it is a valuable metric that has its flaws. Author Edwin Whiting says to be careful when comparing the ROCE of different businesses, since ‘No two businesses are exactly alike.’
How Do You Calculate Return On Capital Employed?
The formula for calculating the return on capital employed is:
Return on Capital Employed = Earnings Before Interest and Tax (EBIT) ÷ (Total Assets – Current Liabilities)
Or for FRIWO:
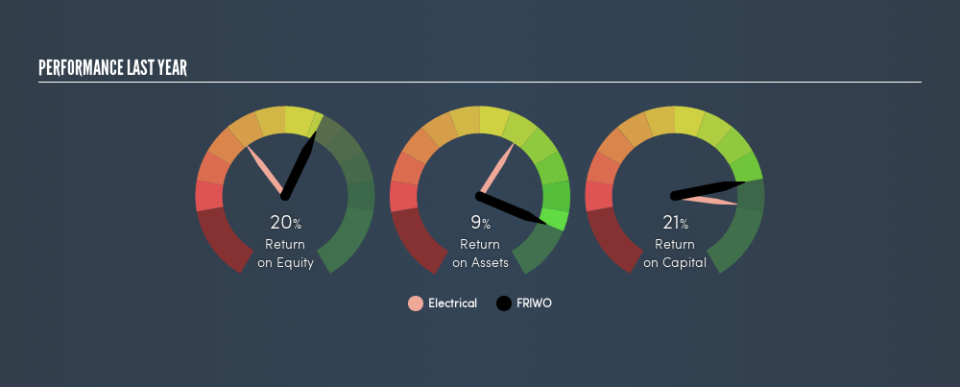
0.21 = €11m ÷ (€53m – €21m) (Based on the trailing twelve months to September 2018.)
Therefore, FRIWO has an ROCE of 21%.
See our latest analysis for FRIWO
Is FRIWO’s ROCE Good?
ROCE can be useful when making comparisons, such as between similar companies. In our analysis, FRIWO’s ROCE is meaningfully higher than the 10% average in the Electrical industry. I think that’s good to see, since it implies the company is better than other companies at making the most of its capital. Regardless of the industry comparison, in absolute terms, FRIWO’s ROCE currently appears to be excellent.
When considering ROCE, bear in mind that it reflects the past and does not necessarily predict the future. ROCE can be deceptive for cyclical businesses, as returns can look incredible in boom times, and terribly low in downturns. ROCE is, after all, simply a snap shot of a single year. How cyclical is FRIWO? You can see for yourself by looking at this free graph of past earnings, revenue and cash flow.
What Are Current Liabilities, And How Do They Affect FRIWO’s ROCE?
Liabilities, such as supplier bills and bank overdrafts, are referred to as current liabilities if they need to be paid within 12 months. Due to the way ROCE is calculated, a high level of current liabilities makes a company look as though it has less capital employed, and thus can (sometimes unfairly) boost the ROCE. To counteract this, we check if a company has high current liabilities, relative to its total assets.
FRIWO has total liabilities of €21m and total assets of €53m. Therefore its current liabilities are equivalent to approximately 40% of its total assets. FRIWO has a medium level of current liabilities, boosting its ROCE somewhat.
Our Take On FRIWO’s ROCE
Despite this, it reports a high ROCE, and may be worth investigating further. Of course, you might find a fantastic investment by looking at a few good candidates. So take a peek at this free list of companies with modest (or no) debt, trading on a P/E below 20.
For those who like to find winning investments this free list of growing companies with recent insider purchasing, could be just the ticket.
We aim to bring you long-term focused research analysis driven by fundamental data. Note that our analysis may not factor in the latest price-sensitive company announcements or qualitative material.
If you spot an error that warrants correction, please contact the editor at editorial-team@simplywallst.com. This article by Simply Wall St is general in nature. It does not constitute a recommendation to buy or sell any stock, and does not take account of your objectives, or your financial situation. Simply Wall St has no position in the stocks mentioned. Thank you for reading.
