
 Yahoo Finance
 Frequency Electronics (NASDAQ:FEIM) Is Looking To Continue Growing Its Returns On Capital
If we want to find a potential multi-bagger, often there are underlying trends that can provide clues. Ideally, a business will show two trends; firstly a growing return on capital employed (ROCE) and secondly, an increasing amount of capital employed. Basically this means that a company has profitable initiatives that it can continue to reinvest in, which is a trait of a compounding machine. So on that note, Frequency Electronics (NASDAQ:FEIM) looks quite promising in regards to its trends of return on capital.
Return On Capital Employed (ROCE): What Is It?
Just to clarify if you're unsure, ROCE is a metric for evaluating how much pre-tax income (in percentage terms) a company earns on the capital invested in its business. Analysts use this formula to calculate it for Frequency Electronics:
Return on Capital Employed = Earnings Before Interest and Tax (EBIT) ÷ (Total Assets - Current Liabilities)
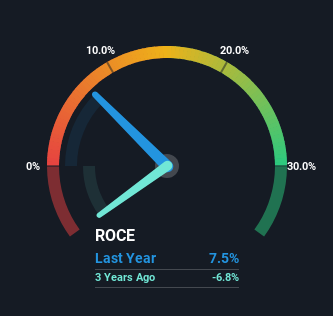
0.075 = US$3.7m ÷ (US$75m - US$25m) (Based on the trailing twelve months to October 2023).
Therefore, Frequency Electronics has an ROCE of 7.5%. In absolute terms, that's a low return and it also under-performs the Electronic industry average of 11%.
Check out our latest analysis for Frequency Electronics
While the past is not representative of the future, it can be helpful to know how a company has performed historically, which is why we have this chart above. If you want to delve into the historical earnings , check out these free graphs detailing revenue and cash flow performance of Frequency Electronics.
How Are Returns Trending?
Like most people, we're pleased that Frequency Electronics is now generating some pretax earnings. While the business is profitable now, it used to be incurring losses on invested capital five years ago. In regards to capital employed, Frequency Electronics is using 37% less capital than it was five years ago, which on the surface, can indicate that the business has become more efficient at generating these returns. This could potentially mean that the company is selling some of its assets.
On a side note, we noticed that the improvement in ROCE appears to be partly fueled by an increase in current liabilities. Effectively this means that suppliers or short-term creditors are now funding 33% of the business, which is more than it was five years ago. Keep an eye out for future increases because when the ratio of current liabilities to total assets gets particularly high, this can introduce some new risks for the business.
In Conclusion...
In summary, it's great to see that Frequency Electronics has been able to turn things around and earn higher returns on lower amounts of capital. Since the stock has only returned 6.3% to shareholders over the last five years, the promising fundamentals may not be recognized yet by investors. So with that in mind, we think the stock deserves further research.
On a final note, we've found 1 warning sign for Frequency Electronics that we think you should be aware of.
While Frequency Electronics may not currently earn the highest returns, we've compiled a list of companies that currently earn more than 25% return on equity. Check out this free list here.
Have feedback on this article? Concerned about the content? Get in touch with us directly. Alternatively, email editorial-team (at) simplywallst.com.
This article by Simply Wall St is general in nature. We provide commentary based on historical data and analyst forecasts only using an unbiased methodology and our articles are not intended to be financial advice. It does not constitute a recommendation to buy or sell any stock, and does not take account of your objectives, or your financial situation. We aim to bring you long-term focused analysis driven by fundamental data. Note that our analysis may not factor in the latest price-sensitive company announcements or qualitative material. Simply Wall St has no position in any stocks mentioned.
