
 Yahoo Finance
 We Like Franklin Covey's (NYSE:FC) Returns And Here's How They're Trending
To find a multi-bagger stock, what are the underlying trends we should look for in a business? Ideally, a business will show two trends; firstly a growing return on capital employed (ROCE) and secondly, an increasing amount of capital employed. Ultimately, this demonstrates that it's a business that is reinvesting profits at increasing rates of return. So when we looked at the ROCE trend of Franklin Covey (NYSE:FC) we really liked what we saw.
What Is Return On Capital Employed (ROCE)?
For those that aren't sure what ROCE is, it measures the amount of pre-tax profits a company can generate from the capital employed in its business. Analysts use this formula to calculate it for Franklin Covey:
Return on Capital Employed = Earnings Before Interest and Tax (EBIT) ÷ (Total Assets - Current Liabilities)
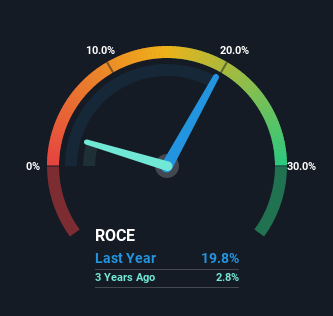
0.20 = US$20m ÷ (US$228m - US$129m) (Based on the trailing twelve months to May 2022).
Thus, Franklin Covey has an ROCE of 20%. That's a fantastic return and not only that, it outpaces the average of 13% earned by companies in a similar industry.
Check out our latest analysis for Franklin Covey
In the above chart we have measured Franklin Covey's prior ROCE against its prior performance, but the future is arguably more important. If you'd like, you can check out the forecasts from the analysts covering Franklin Covey here for free.
The Trend Of ROCE
Franklin Covey is showing promise given that its ROCE is trending up and to the right. More specifically, while the company has kept capital employed relatively flat over the last five years, the ROCE has climbed 6,374% in that same time. So it's likely that the business is now reaping the full benefits of its past investments, since the capital employed hasn't changed considerably. It's worth looking deeper into this though because while it's great that the business is more efficient, it might also mean that going forward the areas to invest internally for the organic growth are lacking.
For the record though, there was a noticeable increase in the company's current liabilities over the period, so we would attribute some of the ROCE growth to that. Essentially the business now has suppliers or short-term creditors funding about 56% of its operations, which isn't ideal. Given it's pretty high ratio, we'd remind investors that having current liabilities at those levels can bring about some risks in certain businesses.
The Key Takeaway
To bring it all together, Franklin Covey has done well to increase the returns it's generating from its capital employed. And a remarkable 198% total return over the last five years tells us that investors are expecting more good things to come in the future. In light of that, we think it's worth looking further into this stock because if Franklin Covey can keep these trends up, it could have a bright future ahead.
On the other side of ROCE, we have to consider valuation. That's why we have a FREE intrinsic value estimation on our platform that is definitely worth checking out.
High returns are a key ingredient to strong performance, so check out our free list ofstocks earning high returns on equity with solid balance sheets.
Have feedback on this article? Concerned about the content? Get in touch with us directly. Alternatively, email editorial-team (at) simplywallst.com.
This article by Simply Wall St is general in nature. We provide commentary based on historical data and analyst forecasts only using an unbiased methodology and our articles are not intended to be financial advice. It does not constitute a recommendation to buy or sell any stock, and does not take account of your objectives, or your financial situation. We aim to bring you long-term focused analysis driven by fundamental data. Note that our analysis may not factor in the latest price-sensitive company announcements or qualitative material. Simply Wall St has no position in any stocks mentioned.
Join A Paid User Research Session
You’ll receive a US$30 Amazon Gift card for 1 hour of your time while helping us build better investing tools for the individual investors like yourself. Sign up here
