
 Yahoo Finance
 Should Franco-Nevada Corporation (TSE:FNV) Focus On Improving This Fundamental Metric?

Want to participate in a short research study? Help shape the future of investing tools and receive a $20 prize!
Many investors are still learning about the various metrics that can be useful when analysing a stock. This article is for those who would like to learn about Return On Equity (ROE). We’ll use ROE to examine Franco-Nevada Corporation (TSE:FNV), by way of a worked example.
Franco-Nevada has a ROE of 4.5%, based on the last twelve months. One way to conceptualize this, is that for each CA$1 of shareholders’ equity it has, the company made CA$0.045 in profit.
View our latest analysis for Franco-Nevada
How Do I Calculate Return On Equity?
The formula for ROE is:
Return on Equity = Net Profit ÷ Shareholders’ Equity
Or for Franco-Nevada:
4.5% = 213.8 ÷ US$4.7b (Based on the trailing twelve months to September 2018.)
It’s easy to understand the ‘net profit’ part of that equation, but ‘shareholders’ equity’ requires further explanation. It is the capital paid in by shareholders, plus any retained earnings. Shareholders’ equity can be calculated by subtracting the total liabilities of the company from the total assets of the company.
What Does ROE Signify?
ROE looks at the amount a company earns relative to the money it has kept within the business. The ‘return’ is the yearly profit. The higher the ROE, the more profit the company is making. So, all else being equal, a high ROE is better than a low one. That means ROE can be used to compare two businesses.
Does Franco-Nevada Have A Good Return On Equity?
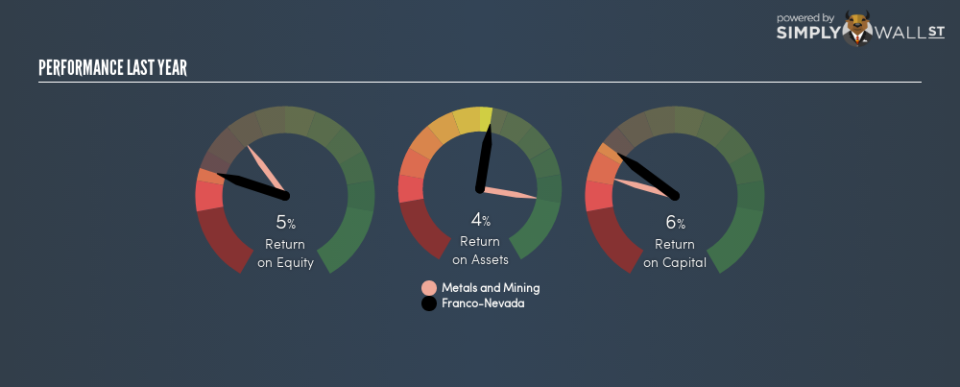
By comparing a company’s ROE with its industry average, we can get a quick measure of how good it is. Importantly, this is far from a perfect measure, because companies differ significantly within the same industry classification. As is clear from the image below, Franco-Nevada has a lower ROE than the average (10%) in the Metals and Mining industry.
That certainly isn’t ideal. We’d prefer see an ROE above the industry average, but it might not matter if the company is undervalued. Still, shareholders might want to check if insiders have been selling.
How Does Debt Impact Return On Equity?
Most companies need money — from somewhere — to grow their profits. That cash can come from issuing shares, retained earnings, or debt. In the first and second cases, the ROE will reflect this use of cash for investment in the business. In the latter case, the use of debt will improve the returns, but will not change the equity. In this manner the use of debt will boost ROE, even though the core economics of the business stay the same.
Franco-Nevada’s Debt And Its 4.5% ROE
Shareholders will be pleased to learn that Franco-Nevada has not one iota of net debt! So although its ROE isn’t that impressive, we shouldn’t judge it harshly on that metric, because it didn’t use debt. After all, when a company has a strong balance sheet, it can often find ways to invest in growth, even if it takes some time.
But It’s Just One Metric
Return on equity is a useful indicator of the ability of a business to generate profits and return them to shareholders. In my book the highest quality companies have high return on equity, despite low debt. All else being equal, a higher ROE is better.
But when a business is high quality, the market often bids it up to a price that reflects this. The rate at which profits are likely to grow, relative to the expectations of profit growth reflected in the current price, must be considered, too. So you might want to check this FREE visualization of analyst forecasts for the company.
If you would prefer check out another company — one with potentially superior financials — then do not miss this free list of interesting companies, that have HIGH return on equity and low debt.
We aim to bring you long-term focused research analysis driven by fundamental data. Note that our analysis may not factor in the latest price-sensitive company announcements or qualitative material.
If you spot an error that warrants correction, please contact the editor at editorial-team@simplywallst.com. This article by Simply Wall St is general in nature. It does not constitute a recommendation to buy or sell any stock, and does not take account of your objectives, or your financial situation. Simply Wall St has no position in the stocks mentioned. On rare occasion, data errors may occur. Thank you for reading.
