
 Yahoo Finance
 Fluor's (NYSE:FLR) Returns On Capital Are Heading Higher
If you're looking for a multi-bagger, there's a few things to keep an eye out for. Typically, we'll want to notice a trend of growing return on capital employed (ROCE) and alongside that, an expanding base of capital employed. If you see this, it typically means it's a company with a great business model and plenty of profitable reinvestment opportunities. So when we looked at Fluor (NYSE:FLR) and its trend of ROCE, we really liked what we saw.
Return On Capital Employed (ROCE): What Is It?
Just to clarify if you're unsure, ROCE is a metric for evaluating how much pre-tax income (in percentage terms) a company earns on the capital invested in its business. To calculate this metric for Fluor, this is the formula:
Return on Capital Employed = Earnings Before Interest and Tax (EBIT) ÷ (Total Assets - Current Liabilities)
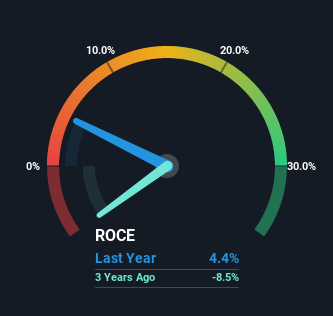
0.044 = US$158m ÷ (US$6.8b - US$3.2b) (Based on the trailing twelve months to December 2022).
Therefore, Fluor has an ROCE of 4.4%. In absolute terms, that's a low return and it also under-performs the Construction industry average of 9.3%.
See our latest analysis for Fluor
In the above chart we have measured Fluor's prior ROCE against its prior performance, but the future is arguably more important. If you'd like to see what analysts are forecasting going forward, you should check out our free report for Fluor.
What Does the ROCE Trend For Fluor Tell Us?
Even though ROCE is still low in absolute terms, it's good to see it's heading in the right direction. We found that the returns on capital employed over the last five years have risen by 168%. That's not bad because this tells for every dollar invested (capital employed), the company is increasing the amount earned from that dollar. Interestingly, the business may be becoming more efficient because it's applying 37% less capital than it was five years ago. Fluor may be selling some assets so it's worth investigating if the business has plans for future investments to increase returns further still.
On a separate but related note, it's important to know that Fluor has a current liabilities to total assets ratio of 47%, which we'd consider pretty high. This can bring about some risks because the company is basically operating with a rather large reliance on its suppliers or other sorts of short-term creditors. Ideally we'd like to see this reduce as that would mean fewer obligations bearing risks.
Our Take On Fluor's ROCE
In the end, Fluor has proven it's capital allocation skills are good with those higher returns from less amount of capital. Given the stock has declined 34% in the last five years, this could be a good investment if the valuation and other metrics are also appealing. That being the case, research into the company's current valuation metrics and future prospects seems fitting.
One more thing to note, we've identified 1 warning sign with Fluor and understanding this should be part of your investment process.
While Fluor isn't earning the highest return, check out this free list of companies that are earning high returns on equity with solid balance sheets.
Have feedback on this article? Concerned about the content? Get in touch with us directly. Alternatively, email editorial-team (at) simplywallst.com.
This article by Simply Wall St is general in nature. We provide commentary based on historical data and analyst forecasts only using an unbiased methodology and our articles are not intended to be financial advice. It does not constitute a recommendation to buy or sell any stock, and does not take account of your objectives, or your financial situation. We aim to bring you long-term focused analysis driven by fundamental data. Note that our analysis may not factor in the latest price-sensitive company announcements or qualitative material. Simply Wall St has no position in any stocks mentioned.
Join A Paid User Research Session
You’ll receive a US$30 Amazon Gift card for 1 hour of your time while helping us build better investing tools for the individual investors like yourself. Sign up here
