
 Yahoo Finance
 Is Flotek Industries Inc’s (NYSE:FTK) Balance Sheet A Threat To Its Future?

While small-cap stocks, such as Flotek Industries Inc (NYSE:FTK) with its market cap of US$99m, are popular for their explosive growth, investors should also be aware of their balance sheet to judge whether the company can survive a downturn. Since FTK is loss-making right now, it’s vital to evaluate the current state of its operations and pathway to profitability. Here are a few basic checks that are good enough to have a broad overview of the company’s financial strength. However, I know these factors are very high-level, so I recommend you dig deeper yourself into FTK here.
How much cash does FTK generate through its operations?
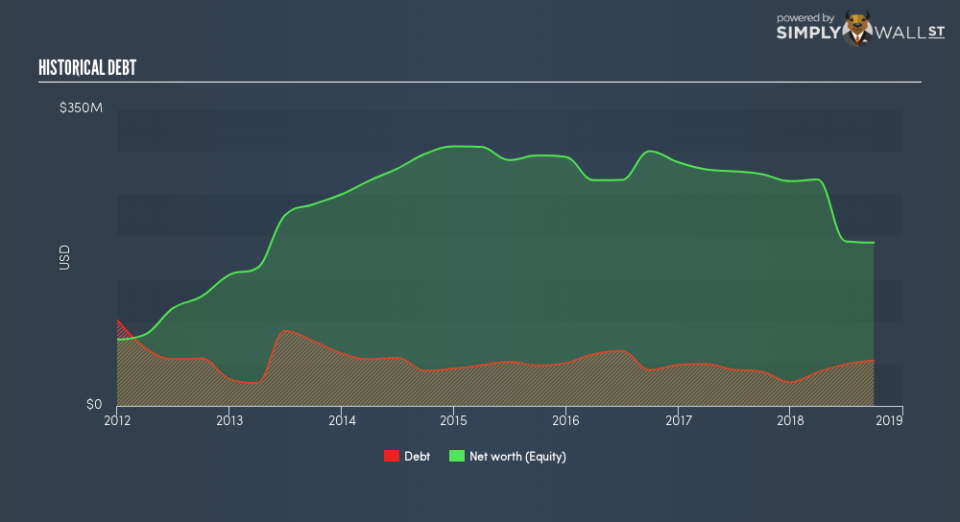
Over the past year, FTK has ramped up its debt from US$41m to US$53m , which is mainly comprised of near term debt. With this rise in debt, the current cash and short-term investment levels stands at US$1.8m , ready to deploy into the business. Moving onto cash from operations, its small level of operating cash flow means calculating cash-to-debt wouldn’t be too useful, though these low levels of cash means that operational efficiency is worth a look. For this article’s sake, I won’t be looking at this today, but you can take a look at some of FTK’s operating efficiency ratios such as ROA here.
Does FTK’s liquid assets cover its short-term commitments?
Looking at FTK’s most recent US$98m liabilities, the company has maintained a safe level of current assets to meet its obligations, with the current ratio last standing at 1.64x. Usually, for Chemicals companies, this is a suitable ratio since there’s a sufficient cash cushion without leaving too much capital idle or in low-earning investments.
Does FTK face the risk of succumbing to its debt-load?
FTK’s level of debt is appropriate relative to its total equity, at 28%. FTK is not taking on too much debt commitment, which may be constraining for future growth. Investors’ risk associated with debt is very low with FTK, and the company has plenty of headroom and ability to raise debt should it need to in the future.
Next Steps:
FTK’s low debt is also met with low coverage. This indicates room for improvement as its cash flow covers less than a quarter of its borrowings, which means its operating efficiency could be better. However, the company exhibits proper management of current assets and upcoming liabilities. This is only a rough assessment of financial health, and I’m sure FTK has company-specific issues impacting its capital structure decisions. I suggest you continue to research Flotek Industries to get a better picture of the stock by looking at:
Future Outlook: What are well-informed industry analysts predicting for FTK’s future growth? Take a look at our free research report of analyst consensus for FTK’s outlook.
Historical Performance: What has FTK’s returns been like over the past? Go into more detail in the past track record analysis and take a look at the free visual representations of our analysis for more clarity.
Other High-Performing Stocks: Are there other stocks that provide better prospects with proven track records? Explore our free list of these great stocks here.
To help readers see past the short term volatility of the financial market, we aim to bring you a long-term focused research analysis purely driven by fundamental data. Note that our analysis does not factor in the latest price-sensitive company announcements.
The author is an independent contributor and at the time of publication had no position in the stocks mentioned. For errors that warrant correction please contact the editor at editorial-team@simplywallst.com.
