
 Yahoo Finance
 Flint's (TSE:FLNT) Returns On Capital Are Heading Higher
If you're not sure where to start when looking for the next multi-bagger, there are a few key trends you should keep an eye out for. Typically, we'll want to notice a trend of growing return on capital employed (ROCE) and alongside that, an expanding base of capital employed. Basically this means that a company has profitable initiatives that it can continue to reinvest in, which is a trait of a compounding machine. So when we looked at Flint (TSE:FLNT) and its trend of ROCE, we really liked what we saw.
Return On Capital Employed (ROCE): What Is It?
For those that aren't sure what ROCE is, it measures the amount of pre-tax profits a company can generate from the capital employed in its business. Analysts use this formula to calculate it for Flint:
Return on Capital Employed = Earnings Before Interest and Tax (EBIT) ÷ (Total Assets - Current Liabilities)
0.11 = CA$16m ÷ (CA$226m - CA$80m) (Based on the trailing twelve months to March 2024).
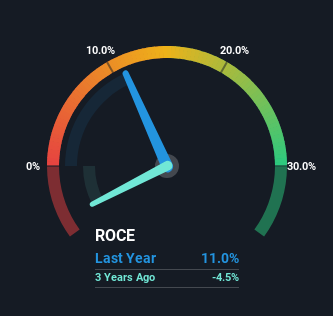
Thus, Flint has an ROCE of 11%. In isolation, that's a pretty standard return but against the Energy Services industry average of 16%, it's not as good.
See our latest analysis for Flint
While the past is not representative of the future, it can be helpful to know how a company has performed historically, which is why we have this chart above. If you're interested in investigating Flint's past further, check out this free graph covering Flint's past earnings, revenue and cash flow.
What Can We Tell From Flint's ROCE Trend?
Investors would be pleased with what's happening at Flint. Over the last four years, returns on capital employed have risen substantially to 11%. The company is effectively making more money per dollar of capital used, and it's worth noting that the amount of capital has increased too, by 32%. So we're very much inspired by what we're seeing at Flint thanks to its ability to profitably reinvest capital.
In another part of our analysis, we noticed that the company's ratio of current liabilities to total assets decreased to 35%, which broadly means the business is relying less on its suppliers or short-term creditors to fund its operations. Therefore we can rest assured that the growth in ROCE is a result of the business' fundamental improvements, rather than a cooking class featuring this company's books.
The Bottom Line
A company that is growing its returns on capital and can consistently reinvest in itself is a highly sought after trait, and that's what Flint has. Given the stock has declined 45% in the last five years, this could be a good investment if the valuation and other metrics are also appealing. That being the case, research into the company's current valuation metrics and future prospects seems fitting.
Like most companies, Flint does come with some risks, and we've found 4 warning signs that you should be aware of.
While Flint may not currently earn the highest returns, we've compiled a list of companies that currently earn more than 25% return on equity. Check out this free list here.
Have feedback on this article? Concerned about the content? Get in touch with us directly. Alternatively, email editorial-team (at) simplywallst.com.
This article by Simply Wall St is general in nature. We provide commentary based on historical data and analyst forecasts only using an unbiased methodology and our articles are not intended to be financial advice. It does not constitute a recommendation to buy or sell any stock, and does not take account of your objectives, or your financial situation. We aim to bring you long-term focused analysis driven by fundamental data. Note that our analysis may not factor in the latest price-sensitive company announcements or qualitative material. Simply Wall St has no position in any stocks mentioned.
