
 Yahoo Finance
 Do Its Financials Have Any Role To Play In Driving BioSyent Inc.'s (CVE:RX) Stock Up Recently?
BioSyent's (CVE:RX) stock is up by a considerable 21% over the past month. We wonder if and what role the company's financials play in that price change as a company's long-term fundamentals usually dictate market outcomes. In this article, we decided to focus on BioSyent's ROE.
Return on equity or ROE is a key measure used to assess how efficiently a company's management is utilizing the company's capital. Simply put, it is used to assess the profitability of a company in relation to its equity capital.
See our latest analysis for BioSyent
How Do You Calculate Return On Equity?
Return on equity can be calculated by using the formula:
Return on Equity = Net Profit (from continuing operations) ÷ Shareholders' Equity
So, based on the above formula, the ROE for BioSyent is:
17% = CA$5.1m ÷ CA$30m (Based on the trailing twelve months to September 2021).
The 'return' is the amount earned after tax over the last twelve months. That means that for every CA$1 worth of shareholders' equity, the company generated CA$0.17 in profit.
What Is The Relationship Between ROE And Earnings Growth?
Thus far, we have learned that ROE measures how efficiently a company is generating its profits. Depending on how much of these profits the company reinvests or "retains", and how effectively it does so, we are then able to assess a company’s earnings growth potential. Assuming everything else remains unchanged, the higher the ROE and profit retention, the higher the growth rate of a company compared to companies that don't necessarily bear these characteristics.
A Side By Side comparison of BioSyent's Earnings Growth And 17% ROE
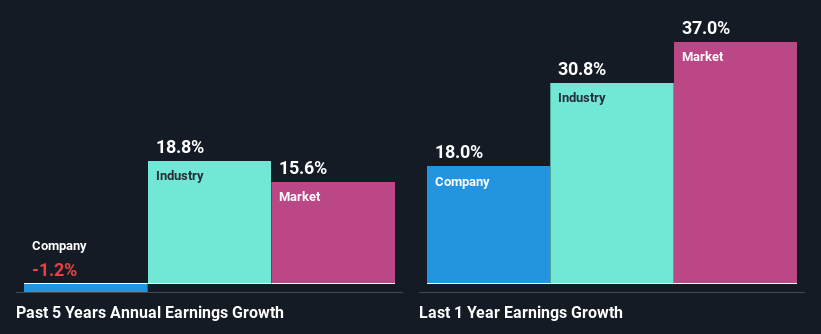
At first glance, BioSyent seems to have a decent ROE. Further, the company's ROE compares quite favorably to the industry average of 13%. Despite this, BioSyent's five year net income growth was quite flat over the past five years. Therefore, there could be some other aspects that could potentially be preventing the company from growing. For example, it could be that the company has a high payout ratio or the business has allocated capital poorly, for instance.
We then compared BioSyent's net income growth with the industry and found that the average industry growth rate was 19% in the same period.
The basis for attaching value to a company is, to a great extent, tied to its earnings growth. The investor should try to establish if the expected growth or decline in earnings, whichever the case may be, is priced in. This then helps them determine if the stock is placed for a bright or bleak future. Has the market priced in the future outlook for RX? You can find out in our latest intrinsic value infographic research report.
Is BioSyent Making Efficient Use Of Its Profits?
BioSyent doesn't pay any dividend, meaning that potentially all of its profits are being reinvested in the business. However, this doesn't explain why the company hasn't seen any growth. It looks like there might be some other reasons to explain the lack in that respect. For example, the business could be in decline.
Summary
In total, it does look like BioSyent has some positive aspects to its business. Yet, the low earnings growth is a bit concerning, especially given that the company has a high rate of return and is reinvesting ma huge portion of its profits. By the looks of it, there could be some other factors, not necessarily in control of the business, that's preventing growth. So far, we've only made a quick discussion around the company's earnings growth. To gain further insights into BioSyent's past profit growth, check out this visualization of past earnings, revenue and cash flows.
Have feedback on this article? Concerned about the content? Get in touch with us directly. Alternatively, email editorial-team (at) simplywallst.com.
This article by Simply Wall St is general in nature. We provide commentary based on historical data and analyst forecasts only using an unbiased methodology and our articles are not intended to be financial advice. It does not constitute a recommendation to buy or sell any stock, and does not take account of your objectives, or your financial situation. We aim to bring you long-term focused analysis driven by fundamental data. Note that our analysis may not factor in the latest price-sensitive company announcements or qualitative material. Simply Wall St has no position in any stocks mentioned.
