
 Yahoo Finance
 How Financially Strong Is Vistra Energy Corp. (NYSE:VST)?
Want to participate in a short research study? Help shape the future of investing tools and you could win a $250 gift card!
Investors seeking to preserve capital in a volatile environment might consider large-cap stocks such as Vistra Energy Corp. (NYSE:VST) a safer option. Big corporations are much sought after by risk-averse investors who find diversified revenue streams and strong capital returns attractive. But, its financial health remains the key to continued success. This article will examine Vistra Energy’s financial liquidity and debt levels to get an idea of whether the company can deal with cyclical downturns and maintain funds to accommodate strategic spending for future growth. Note that this commentary is very high-level and solely focused on financial health, so I suggest you dig deeper yourself into VST here.
View our latest analysis for Vistra Energy
Does VST Produce Much Cash Relative To Its Debt?
VST has built up its total debt levels in the last twelve months, from US$4.4b to US$11b , which accounts for long term debt. With this increase in debt, VST's cash and short-term investments stands at US$562m , ready to be used for running the business. Additionally, VST has generated US$1.9b in operating cash flow over the same time period, leading to an operating cash to total debt ratio of 16%, signalling that VST’s current level of operating cash is not high enough to cover debt.
Can VST pay its short-term liabilities?
Looking at VST’s US$3.2b in current liabilities, it appears that the company has been able to meet these obligations given the level of current assets of US$3.3b, with a current ratio of 1.03x. The current ratio is the number you get when you divide current assets by current liabilities. For Renewable Energy companies, this ratio is within a sensible range as there's enough of a cash buffer without holding too much capital in low return investments.
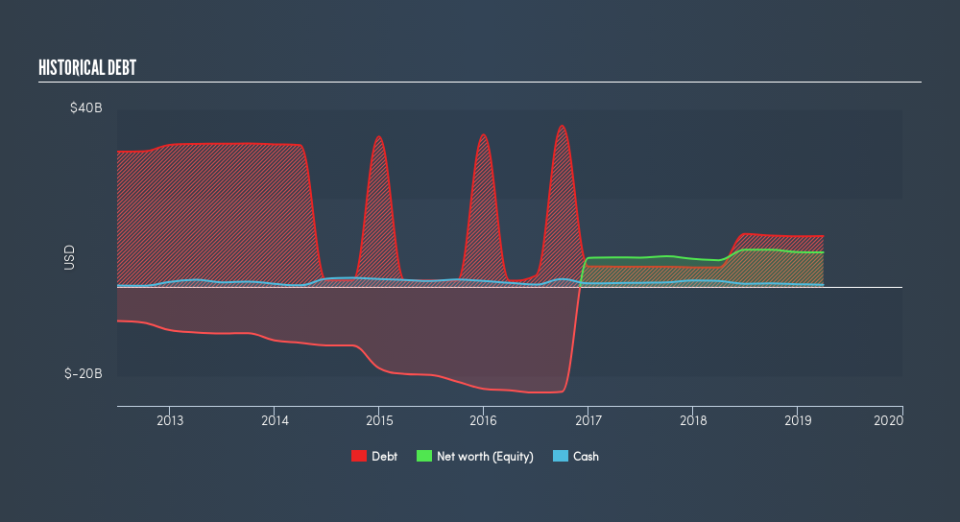
Is VST’s debt level acceptable?
Considering Vistra Energy’s total debt outweighs its equity, the company is deemed highly levered. This isn’t uncommon for large companies because interest payments on debt are tax deductible, meaning debt can be a cheaper source of capital than equity. Consequently, larger-cap organisations tend to enjoy lower cost of capital as a result of easily attained financing, providing an advantage over smaller companies. We can assess the sustainability of VST’s debt levels to the test by looking at how well interest payments are covered by earnings. Net interest should be covered by earnings before interest and tax (EBIT) by at least three times to be safe. In VST's case, the ratio of 1.82x suggests that interest is not strongly covered. Given the sheer size of Vistra Energy, it's unlikely to default on interest payments and enter bankruptcy. However, compared to an amply profitable large-cap peer, debtors may see more risk in lending to VST.
Next Steps:
VST’s debt and cash flow levels indicate room for improvement. Its cash flow coverage of less than a quarter of debt means that operating efficiency could be an issue. Though, the company exhibits proper management of current assets and upcoming liabilities. I admit this is a fairly basic analysis for VST's financial health. Other important fundamentals need to be considered alongside. I recommend you continue to research Vistra Energy to get a more holistic view of the stock by looking at:
Future Outlook: What are well-informed industry analysts predicting for VST’s future growth? Take a look at our free research report of analyst consensus for VST’s outlook.
Valuation: What is VST worth today? Is the stock undervalued, even when its growth outlook is factored into its intrinsic value? The intrinsic value infographic in our free research report helps visualize whether VST is currently mispriced by the market.
Other High-Performing Stocks: Are there other stocks that provide better prospects with proven track records? Explore our free list of these great stocks here.
We aim to bring you long-term focused research analysis driven by fundamental data. Note that our analysis may not factor in the latest price-sensitive company announcements or qualitative material.
If you spot an error that warrants correction, please contact the editor at editorial-team@simplywallst.com. This article by Simply Wall St is general in nature. It does not constitute a recommendation to buy or sell any stock, and does not take account of your objectives, or your financial situation. Simply Wall St has no position in the stocks mentioned. Thank you for reading.
