
 Yahoo Finance
 How Financially Strong Is Verint Systems Inc. (NASDAQ:VRNT)?

Want to participate in a short research study? Help shape the future of investing tools and you could win a $250 gift card!
Small and large cap stocks are widely popular for a variety of reasons, however, mid-cap companies such as Verint Systems Inc. (NASDAQ:VRNT), with a market cap of US$3.8b, often get neglected by retail investors. However, history shows that overlooked mid-cap companies have performed better on a risk-adjusted manner than the smaller and larger segment of the market. Let’s take a look at VRNT’s debt concentration and assess their financial liquidity to get an idea of their ability to fund strategic acquisitions and grow through cyclical pressures. Note that this commentary is very high-level and solely focused on financial health, so I suggest you dig deeper yourself into VRNT here.
See our latest analysis for Verint Systems
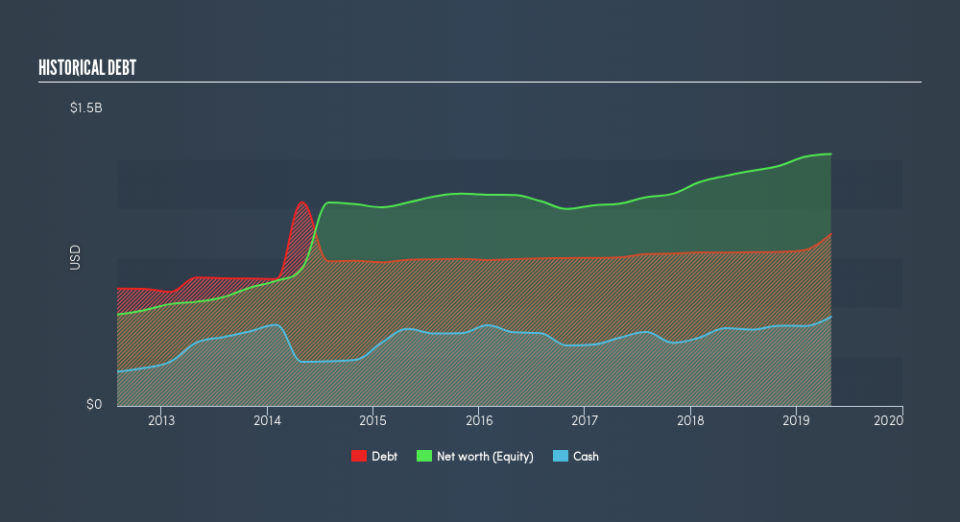
Does VRNT Produce Much Cash Relative To Its Debt?
VRNT's debt levels surged from US$775m to US$870m over the last 12 months , which accounts for long term debt. With this rise in debt, VRNT currently has US$451m remaining in cash and short-term investments to keep the business going. Additionally, VRNT has produced US$248m in operating cash flow over the same time period, resulting in an operating cash to total debt ratio of 29%, indicating that VRNT’s debt is appropriately covered by operating cash.
Can VRNT meet its short-term obligations with the cash in hand?
At the current liabilities level of US$661m, it seems that the business has maintained a safe level of current assets to meet its obligations, with the current ratio last standing at 1.5x. The current ratio is the number you get when you divide current assets by current liabilities. For Software companies, this ratio is within a sensible range since there's a sufficient cash cushion without leaving too much capital idle or in low-earning investments.
Can VRNT service its debt comfortably?
VRNT is a relatively highly levered company with a debt-to-equity of 68%. This is not uncommon for a mid-cap company given that debt tends to be lower-cost and at times, more accessible. No matter how high the company’s debt, if it can easily cover the interest payments, it’s considered to be efficient with its use of excess leverage. A company generating earnings after interest and tax at least three times its net interest payments is considered financially sound. In VRNT's case, the ratio of 3.86x suggests that interest is appropriately covered, which means that lenders may be less hesitant to lend out more funding as VRNT’s high interest coverage is seen as responsible and safe practice.
Next Steps:
VRNT’s high cash coverage means that, although its debt levels are high, the company is able to utilise its borrowings efficiently in order to generate cash flow. This may mean this is an optimal capital structure for the business, given that it is also meeting its short-term commitment. Keep in mind I haven't considered other factors such as how VRNT has been performing in the past. I recommend you continue to research Verint Systems to get a more holistic view of the mid-cap by looking at:
Future Outlook: What are well-informed industry analysts predicting for VRNT’s future growth? Take a look at our free research report of analyst consensus for VRNT’s outlook.
Valuation: What is VRNT worth today? Is the stock undervalued, even when its growth outlook is factored into its intrinsic value? The intrinsic value infographic in our free research report helps visualize whether VRNT is currently mispriced by the market.
Other High-Performing Stocks: Are there other stocks that provide better prospects with proven track records? Explore our free list of these great stocks here.
We aim to bring you long-term focused research analysis driven by fundamental data. Note that our analysis may not factor in the latest price-sensitive company announcements or qualitative material.
If you spot an error that warrants correction, please contact the editor at editorial-team@simplywallst.com. This article by Simply Wall St is general in nature. It does not constitute a recommendation to buy or sell any stock, and does not take account of your objectives, or your financial situation. Simply Wall St has no position in the stocks mentioned. Thank you for reading.
