
 Yahoo Finance
 How Financially Strong Is Norwegian Cruise Line Holdings Ltd. (NYSE:NCLH)?

There are a number of reasons that attract investors towards large-cap companies such as Norwegian Cruise Line Holdings Ltd. (NYSE:NCLH), with a market cap of US$12b. Risk-averse investors who are attracted to diversified streams of revenue and strong capital returns tend to seek out these large companies. However, the health of the financials determines whether the company continues to succeed. I will provide an overview of Norwegian Cruise Line Holdings’s financial liquidity and leverage to give you an idea of Norwegian Cruise Line Holdings’s position to take advantage of potential acquisitions or comfortably endure future downturns. Note that this commentary is very high-level and solely focused on financial health, so I suggest you dig deeper yourself into NCLH here.
View our latest analysis for Norwegian Cruise Line Holdings
Does NCLH Produce Much Cash Relative To Its Debt?
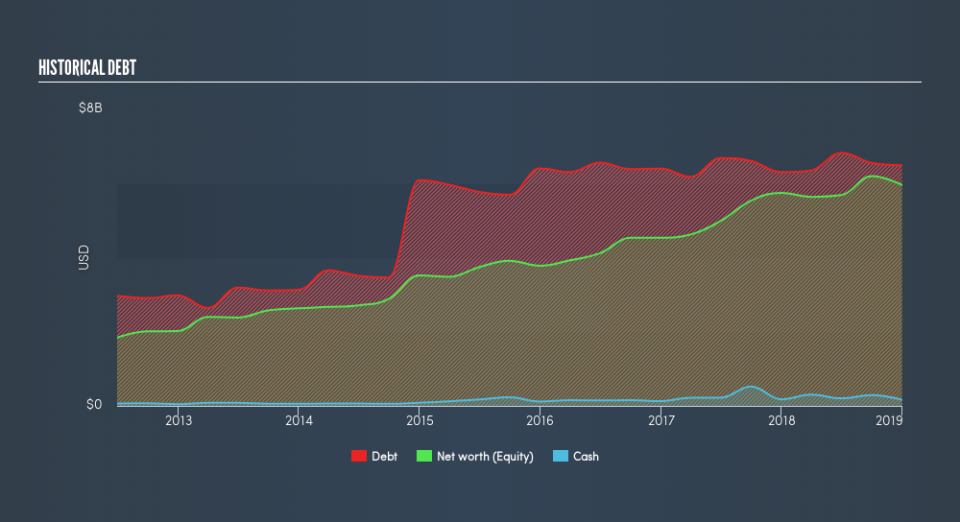
NCLH has sustained its debt level by about US$6.5b over the last 12 months which accounts for long term debt. At this current level of debt, NCLH currently has US$164m remaining in cash and short-term investments , ready to be used for running the business. Moreover, NCLH has produced cash from operations of US$2.1b in the last twelve months, resulting in an operating cash to total debt ratio of 32%, indicating that NCLH’s debt is appropriately covered by operating cash.
Can NCLH meet its short-term obligations with the cash in hand?
With current liabilities at US$3.2b, it appears that the company may not be able to easily meet these obligations given the level of current assets of US$550m, with a current ratio of 0.17x. The current ratio is the number you get when you divide current assets by current liabilities.
Is NCLH’s debt level acceptable?
Norwegian Cruise Line Holdings is a highly levered company given that total debt exceeds equity. This isn’t uncommon for large companies because interest payments on debt are tax deductible, meaning debt can be a cheaper source of capital than equity. Accordingly, large companies often have an advantage over small-caps through lower cost of capital due to cheaper financing. We can test if NCLH’s debt levels are sustainable by measuring interest payments against earnings of a company. Preferably, earnings before interest and tax (EBIT) should be at least three times as large as net interest. For NCLH, the ratio of 4.62x suggests that interest is appropriately covered. High interest coverage serves as an indication of the safety of a company, which highlights why many large organisations like NCLH are considered a risk-averse investment.
Next Steps:
NCLH’s high cash coverage means that, although its debt levels are high, the company is able to utilise its borrowings efficiently in order to generate cash flow. Though its lack of liquidity raises questions over current asset management practices for the large-cap. This is only a rough assessment of financial health, and I'm sure NCLH has company-specific issues impacting its capital structure decisions. I suggest you continue to research Norwegian Cruise Line Holdings to get a better picture of the stock by looking at:
Future Outlook: What are well-informed industry analysts predicting for NCLH’s future growth? Take a look at our free research report of analyst consensus for NCLH’s outlook.
Valuation: What is NCLH worth today? Is the stock undervalued, even when its growth outlook is factored into its intrinsic value? The intrinsic value infographic in our free research report helps visualize whether NCLH is currently mispriced by the market.
Other High-Performing Stocks: Are there other stocks that provide better prospects with proven track records? Explore our free list of these great stocks here.
We aim to bring you long-term focused research analysis driven by fundamental data. Note that our analysis may not factor in the latest price-sensitive company announcements or qualitative material.
If you spot an error that warrants correction, please contact the editor at editorial-team@simplywallst.com. This article by Simply Wall St is general in nature. It does not constitute a recommendation to buy or sell any stock, and does not take account of your objectives, or your financial situation. Simply Wall St has no position in the stocks mentioned. Thank you for reading.
