
 Yahoo Finance
 How Financially Strong Is Farmmi, Inc. (NASDAQ:FAMI)?

Want to participate in a short research study? Help shape the future of investing tools and receive a $60 prize!
While small-cap stocks, such as Farmmi, Inc. (NASDAQ:FAMI) with its market cap of US$56m, are popular for their explosive growth, investors should also be aware of their balance sheet to judge whether the company can survive a downturn. Evaluating financial health as part of your investment thesis is crucial, as mismanagement of capital can lead to bankruptcies, which occur at a higher rate for small-caps. I believe these basic checks tell most of the story you need to know. Nevertheless, since I only look at basic financial figures, I’d encourage you to dig deeper yourself into FAMI here.
How much cash does FAMI generate through its operations?
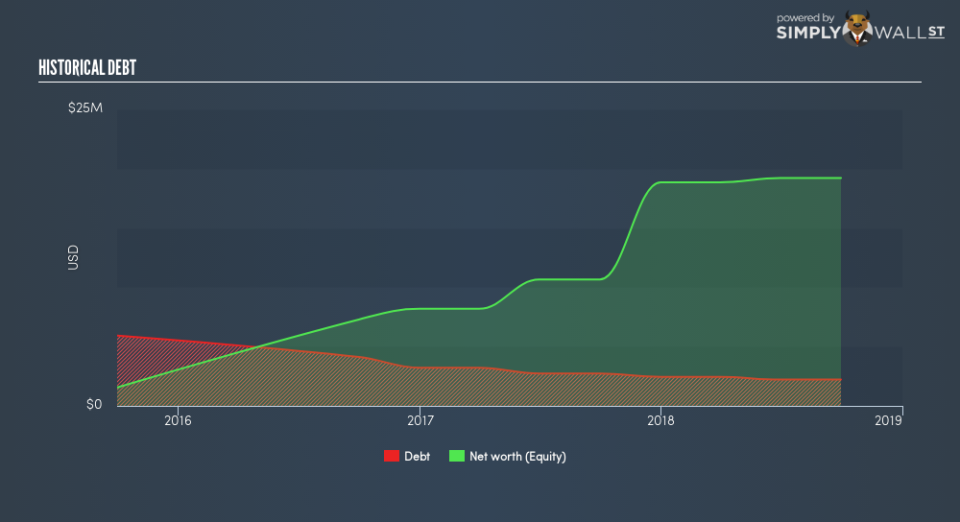
Over the past year, FAMI has reduced its debt from US$2.7m to US$2.2m , which also accounts for long term debt. With this debt payback, FAMI currently has US$4.9m remaining in cash and short-term investments for investing into the business. Moving onto cash from operations, its operating cash flow is not yet significant enough to calculate a meaningful cash-to-debt ratio, indicating that operational efficiency is something we’d need to take a look at. As the purpose of this article is a high-level overview, I won’t be looking at this today, but you can take a look at some of FAMI’s operating efficiency ratios such as ROA here.
Does FAMI’s liquid assets cover its short-term commitments?
With current liabilities at US$2.2m, it seems that the business has been able to meet these commitments with a current assets level of US$21m, leading to a 9.6x current account ratio. Having said that, a ratio above 3x may be considered excessive by some investors, yet this is not usually a major negative for a company.
Does FAMI face the risk of succumbing to its debt-load?
With debt at 12% of equity, FAMI may be thought of as appropriately levered. This range is considered safe as FAMI is not taking on too much debt obligation, which may be constraining for future growth. We can check to see whether FAMI is able to meet its debt obligations by looking at the net interest coverage ratio. A company generating earnings before interest and tax (EBIT) at least three times its net interest payments is considered financially sound. In FAMI’s, case, the ratio of 20.03x suggests that interest is comfortably covered, which means that lenders may be less hesitant to lend out more funding as FAMI’s high interest coverage is seen as responsible and safe practice.
Next Steps:
FAMI’s high cash coverage and low debt levels indicate its ability to utilise its borrowings efficiently in order to generate ample cash flow. Furthermore, the company will be able to pay all of its upcoming liabilities from its current short-term assets. This is only a rough assessment of financial health, and I’m sure FAMI has company-specific issues impacting its capital structure decisions. I recommend you continue to research Farmmi to get a more holistic view of the stock by looking at:
Future Outlook: What are well-informed industry analysts predicting for FAMI’s future growth? Take a look at our free research report of analyst consensus for FAMI’s outlook.
Historical Performance: What has FAMI’s returns been like over the past? Go into more detail in the past track record analysis and take a look at the free visual representations of our analysis for more clarity.
Other High-Performing Stocks: Are there other stocks that provide better prospects with proven track records? Explore our free list of these great stocks here.
To help readers see past the short term volatility of the financial market, we aim to bring you a long-term focused research analysis purely driven by fundamental data. Note that our analysis does not factor in the latest price-sensitive company announcements.
The author is an independent contributor and at the time of publication had no position in the stocks mentioned. For errors that warrant correction please contact the editor at editorial-team@simplywallst.com.
