
 Yahoo Finance
 How Financially Strong Is Corsa Coal Corp (CVE:CSO)?

While small-cap stocks, such as Corsa Coal Corp (CVE:CSO) with its market cap of CA$81m, are popular for their explosive growth, investors should also be aware of their balance sheet to judge whether the company can survive a downturn. So, understanding the company’s financial health becomes essential, as mismanagement of capital can lead to bankruptcies, which occur at a higher rate for small-caps. I believe these basic checks tell most of the story you need to know. Nevertheless, given that I have not delve into the company-specifics, I’d encourage you to dig deeper yourself into CSO here.
How much cash does CSO generate through its operations?
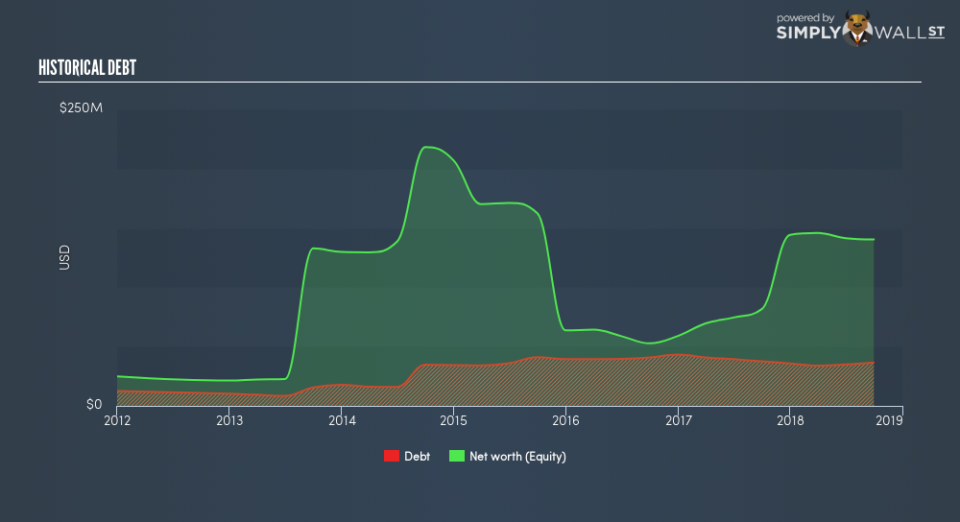
Over the past year, CSO has maintained its debt levels at around US$37m made up of current and long term debt. At this constant level of debt, CSO currently has US$9.1m remaining in cash and short-term investments , ready to deploy into the business. Moreover, CSO has generated US$18m in operating cash flow in the last twelve months, resulting in an operating cash to total debt ratio of 50%, indicating that CSO’s operating cash is sufficient to cover its debt. This ratio can also be a sign of operational efficiency as an alternative to return on assets. In CSO’s case, it is able to generate 0.5x cash from its debt capital.
Can CSO pay its short-term liabilities?
Looking at CSO’s most recent US$79m liabilities, it appears that the company may not have an easy time meeting these commitments with a current assets level of US$57m, leading to a current ratio of 0.72x.
Does CSO face the risk of succumbing to its debt-load?
With a debt-to-equity ratio of 26%, CSO’s debt level may be seen as prudent. This range is considered safe as CSO is not taking on too much debt obligation, which can be restrictive and risky for equity-holders. We can check to see whether CSO is able to meet its debt obligations by looking at the net interest coverage ratio. A company generating earnings before interest and tax (EBIT) at least three times its net interest payments is considered financially sound. In CSO’s, case, the ratio of 6.15x suggests that interest is appropriately covered, which means that lenders may be inclined to lend more money to the company, as it is seen as safe in terms of payback.
Next Steps:
CSO’s high cash coverage and appropriate debt levels indicate its ability to utilise its borrowings efficiently in order to generate ample cash flow. Though its low liquidity raises concerns over whether current asset management practices are properly implemented for the small-cap. Keep in mind I haven’t considered other factors such as how CSO has been performing in the past. I suggest you continue to research Corsa Coal to get a more holistic view of the stock by looking at:
Historical Performance: What has CSO’s returns been like over the past? Go into more detail in the past track record analysis and take a look at the free visual representations of our analysis for more clarity.
Other High-Performing Stocks: Are there other stocks that provide better prospects with proven track records? Explore our free list of these great stocks here.
To help readers see past the short term volatility of the financial market, we aim to bring you a long-term focused research analysis purely driven by fundamental data. Note that our analysis does not factor in the latest price-sensitive company announcements.
The author is an independent contributor and at the time of publication had no position in the stocks mentioned. For errors that warrant correction please contact the editor at editorial-team@simplywallst.com.
