
 Yahoo Finance
 How Financially Strong Is Clean Seed Capital Group Ltd (CVE:CSX)?

Investors are always looking for growth in small-cap stocks like Clean Seed Capital Group Ltd (CVE:CSX), with a market cap of CA$22.1m. However, an important fact which most ignore is: how financially healthy is the business? Since CSX is loss-making right now, it’s vital to evaluate the current state of its operations and pathway to profitability. Here are few basic financial health checks you should consider before taking the plunge. Though, given that I have not delve into the company-specifics, I suggest you dig deeper yourself into CSX here.
How does CSX’s operating cash flow stack up against its debt?
Over the past year, CSX has ramped up its debt from CA$571.7k to CA$1.1m – this includes both the current and long-term debt. With this increase in debt, CSX currently has CA$101.3k remaining in cash and short-term investments , ready to deploy into the business. Moving onto cash from operations, its operating cash flow is not yet significant enough to calculate a meaningful cash-to-debt ratio, indicating that operational efficiency is something we’d need to take a look at. As the purpose of this article is a high-level overview, I won’t be looking at this today, but you can assess some of CSX’s operating efficiency ratios such as ROA here.
Does CSX’s liquid assets cover its short-term commitments?
Looking at CSX’s most recent CA$1.9m liabilities, the company is not able to meet these obligations given the level of current assets of CA$954.4k, with a current ratio of 0.49x below the prudent level of 3x.
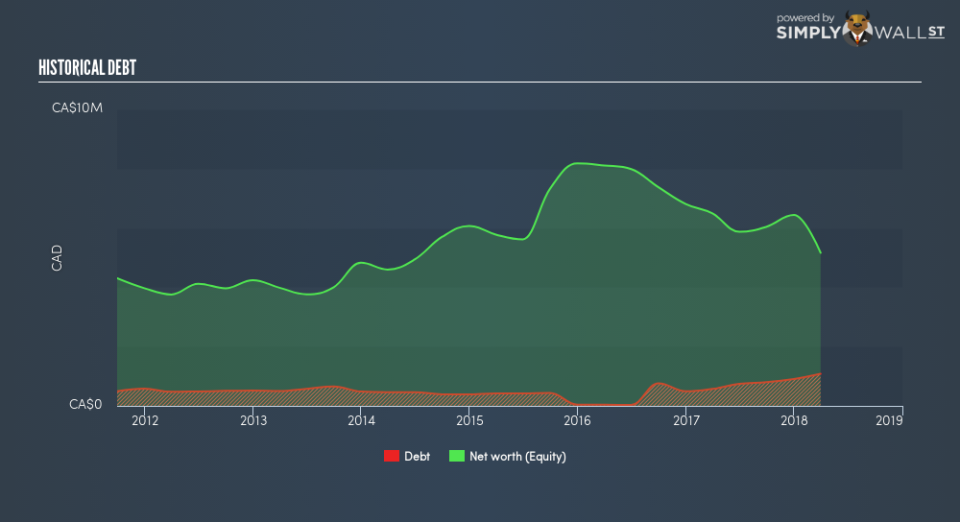
Does CSX face the risk of succumbing to its debt-load?
CSX’s level of debt is appropriate relative to its total equity, at 21.0%. This range is considered safe as CSX is not taking on too much debt obligation, which may be constraining for future growth. Risk around debt is very low for CSX, and the company also has the ability and headroom to increase debt if needed going forward.
Next Steps:
CSX’s low debt is also met with low coverage. This indicates room for improvement as its cash flow covers less than a quarter of its borrowings, which means its operating efficiency could be better. In addition to this, its low liquidity raises concerns over whether current asset management practices are properly implemented for the small-cap. I admit this is a fairly basic analysis for CSX’s financial health. Other important fundamentals need to be considered alongside. I recommend you continue to research Clean Seed Capital Group to get a better picture of the stock by looking at:
Historical Performance: What has CSX’s returns been like over the past? Go into more detail in the past track record analysis and take a look at the free visual representations of our analysis for more clarity.
Other High-Performing Stocks: Are there other stocks that provide better prospects with proven track records? Explore our free list of these great stocks here.
To help readers see past the short term volatility of the financial market, we aim to bring you a long-term focused research analysis purely driven by fundamental data. Note that our analysis does not factor in the latest price-sensitive company announcements.
The author is an independent contributor and at the time of publication had no position in the stocks mentioned. For errors that warrant correction please contact the editor at editorial-team@simplywallst.com.
