
 Yahoo Finance
 How Financially Strong Is CCL Industries Inc. (TSE:CCL.B)?

Want to participate in a short research study? Help shape the future of investing tools and you could win a $250 gift card!
Stocks with market capitalization between $2B and $10B, such as CCL Industries Inc. (TSE:CCL.B) with a size of CA$9.9b, do not attract as much attention from the investing community as do the small-caps and large-caps. Surprisingly though, when accounted for risk, mid-caps have delivered better returns compared to the two other categories of stocks. Let’s take a look at CCL.B’s debt concentration and assess their financial liquidity to get an idea of their ability to fund strategic acquisitions and grow through cyclical pressures. Note that this information is centred entirely on financial health and is a top-level understanding, so I encourage you to look further into CCL.B here.
Check out our latest analysis for CCL Industries
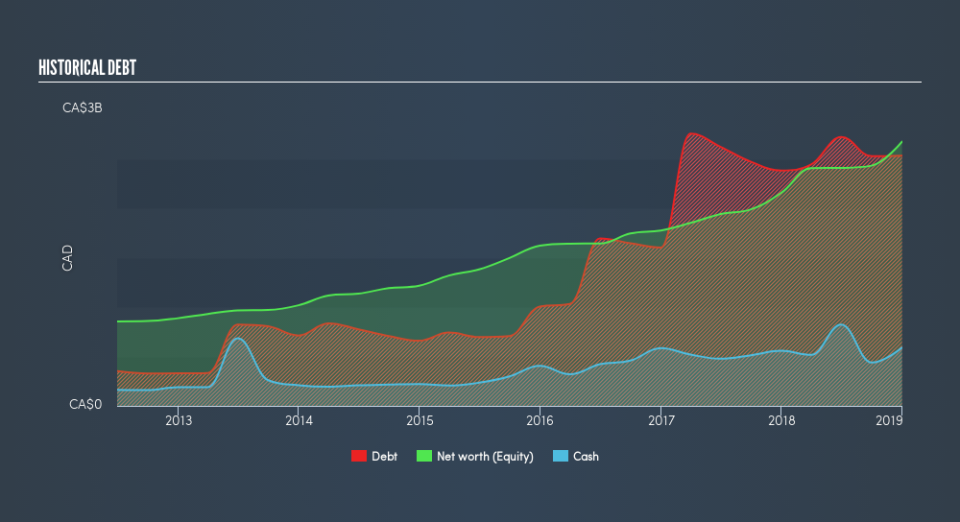
CCL.B’s Debt (And Cash Flows)
Over the past year, CCL.B has ramped up its debt from CA$2.4b to CA$2.5b , which includes long-term debt. With this growth in debt, CCL.B's cash and short-term investments stands at CA$589m , ready to be used for running the business. Additionally, CCL.B has produced cash from operations of CA$773m during the same period of time, resulting in an operating cash to total debt ratio of 31%, meaning that CCL.B’s debt is appropriately covered by operating cash.
Does CCL.B’s liquid assets cover its short-term commitments?
At the current liabilities level of CA$1.3b, it seems that the business has maintained a safe level of current assets to meet its obligations, with the current ratio last standing at 1.58x. The current ratio is the number you get when you divide current assets by current liabilities. Generally, for Packaging companies, this is a reasonable ratio since there is a bit of a cash buffer without leaving too much capital in a low-return environment.
Does CCL.B face the risk of succumbing to its debt-load?
With debt reaching 95% of equity, CCL.B may be thought of as relatively highly levered. This is not unusual for mid-caps as debt tends to be a cheaper and faster source of funding for some businesses. We can test if CCL.B’s debt levels are sustainable by measuring interest payments against earnings of a company. Ideally, earnings before interest and tax (EBIT) should cover net interest by at least three times. For CCL.B, the ratio of 9.12x suggests that interest is appropriately covered, which means that lenders may be inclined to lend more money to the company, as it is seen as safe in terms of payback.
Next Steps:
CCL.B’s high cash coverage means that, although its debt levels are high, the company is able to utilise its borrowings efficiently in order to generate cash flow. Since there is also no concerns around CCL.B's liquidity needs, this may be its optimal capital structure for the time being. I admit this is a fairly basic analysis for CCL.B's financial health. Other important fundamentals need to be considered alongside. I recommend you continue to research CCL Industries to get a better picture of the mid-cap by looking at:
Future Outlook: What are well-informed industry analysts predicting for CCL.B’s future growth? Take a look at our free research report of analyst consensus for CCL.B’s outlook.
Valuation: What is CCL.B worth today? Is the stock undervalued, even when its growth outlook is factored into its intrinsic value? The intrinsic value infographic in our free research report helps visualize whether CCL.B is currently mispriced by the market.
Other High-Performing Stocks: Are there other stocks that provide better prospects with proven track records? Explore our free list of these great stocks here.
We aim to bring you long-term focused research analysis driven by fundamental data. Note that our analysis may not factor in the latest price-sensitive company announcements or qualitative material.
If you spot an error that warrants correction, please contact the editor at editorial-team@simplywallst.com. This article by Simply Wall St is general in nature. It does not constitute a recommendation to buy or sell any stock, and does not take account of your objectives, or your financial situation. Simply Wall St has no position in the stocks mentioned. Thank you for reading.
