
 Yahoo Finance
 How Financially Strong Is Bed Bath & Beyond Inc. (NASDAQ:BBBY)?

Want to participate in a short research study? Help shape the future of investing tools and you could win a $250 gift card!
Investors are always looking for growth in small-cap stocks like Bed Bath & Beyond Inc. (NASDAQ:BBBY), with a market cap of US$1.3b. However, an important fact which most ignore is: how financially healthy is the business? Given that BBBY is not presently profitable, it’s vital to understand the current state of its operations and pathway to profitability. The following basic checks can help you get a picture of the company's balance sheet strength. Nevertheless, this is just a partial view of the stock, and I’d encourage you to dig deeper yourself into BBBY here.
BBBY’s Debt (And Cash Flows)
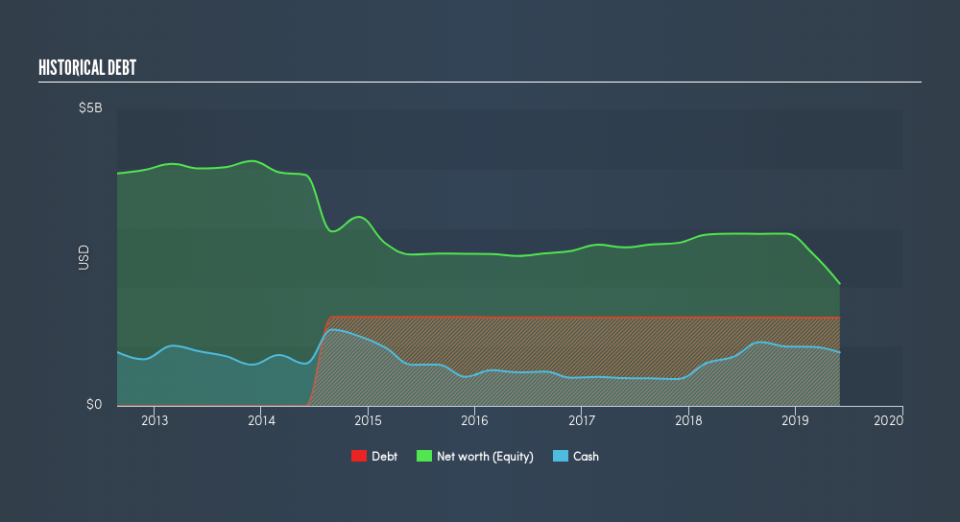
Over the past year, BBBY has ramped up its debt from US$1.5b to US$3.7b – this includes long-term debt. With this rise in debt, BBBY currently has US$902m remaining in cash and short-term investments to keep the business going. Moreover, BBBY has generated cash from operations of US$763m in the last twelve months, resulting in an operating cash to total debt ratio of 21%, signalling that BBBY’s operating cash is sufficient to cover its debt.
Can BBBY pay its short-term liabilities?
At the current liabilities level of US$2.4b, it seems that the business has maintained a safe level of current assets to meet its obligations, with the current ratio last standing at 1.52x. The current ratio is the number you get when you divide current assets by current liabilities. Generally, for Specialty Retail companies, this is a reasonable ratio since there is a bit of a cash buffer without leaving too much capital in a low-return environment.
Can BBBY service its debt comfortably?
BBBY is a relatively highly levered company with a debt-to-equity of 72%. This is somewhat unusual for small-caps companies, since lenders are often hesitant to provide attractive interest rates to less-established businesses. However, since BBBY is currently unprofitable, sustainability of its current state of operations becomes a concern. Maintaining a high level of debt, while revenues are still below costs, can be dangerous as liquidity tends to dry up in unexpected downturns.
Next Steps:
Although BBBY’s debt level is towards the higher end of the spectrum, its cash flow coverage seems adequate to meet obligations which means its debt is being efficiently utilised. This may mean this is an optimal capital structure for the business, given that it is also meeting its short-term commitment. Keep in mind I haven't considered other factors such as how BBBY has been performing in the past. I suggest you continue to research Bed Bath & Beyond to get a better picture of the small-cap by looking at:
Future Outlook: What are well-informed industry analysts predicting for BBBY’s future growth? Take a look at our free research report of analyst consensus for BBBY’s outlook.
Valuation: What is BBBY worth today? Is the stock undervalued, even when its growth outlook is factored into its intrinsic value? The intrinsic value infographic in our free research report helps visualize whether BBBY is currently mispriced by the market.
Other High-Performing Stocks: Are there other stocks that provide better prospects with proven track records? Explore our free list of these great stocks here.
We aim to bring you long-term focused research analysis driven by fundamental data. Note that our analysis may not factor in the latest price-sensitive company announcements or qualitative material.
If you spot an error that warrants correction, please contact the editor at editorial-team@simplywallst.com. This article by Simply Wall St is general in nature. It does not constitute a recommendation to buy or sell any stock, and does not take account of your objectives, or your financial situation. Simply Wall St has no position in the stocks mentioned. Thank you for reading.
