
 Yahoo Finance
 Fewer Investors Than Expected Jumping On Gullewa Limited (ASX:GUL)

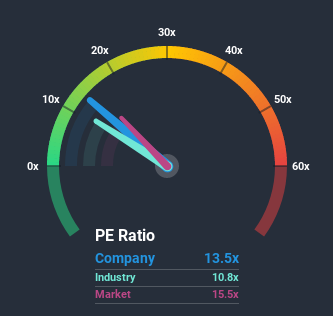
With a price-to-earnings (or "P/E") ratio of 13.5x Gullewa Limited (ASX:GUL) may be sending bullish signals at the moment, given that almost half of all companies in Australia have P/E ratios greater than 16x and even P/E's higher than 30x are not unusual. Although, it's not wise to just take the P/E at face value as there may be an explanation why it's limited.
As an illustration, earnings have deteriorated at Gullewa over the last year, which is not ideal at all. One possibility is that the P/E is low because investors think the company won't do enough to avoid underperforming the broader market in the near future. However, if this doesn't eventuate then existing shareholders may be feeling optimistic about the future direction of the share price.
View our latest analysis for Gullewa
Does Gullewa Have A Relatively High Or Low P/E For Its Industry?
An inspection of average P/E's throughout Gullewa's industry may help to explain its low P/E ratio. You'll notice in the figure below that P/E ratios in the Metals and Mining industry are also lower than the market. So we'd say there is merit in the premise that the company's ratio being shaped by its industry at this time. In the context of the Metals and Mining industry's current setting, most of its constituents' P/E's would be expected to be toned down. Nevertheless, the company's P/E should be primarily influenced by its own financial performance.
We don't have analyst forecasts, but you can see how recent trends are setting up the company for the future by checking out our free report on Gullewa's earnings, revenue and cash flow.
Is There Any Growth For Gullewa?
The only time you'd be truly comfortable seeing a P/E as low as Gullewa's is when the company's growth is on track to lag the market.
Retrospectively, the last year delivered a frustrating 35% decrease to the company's bottom line. This has erased any of its gains during the last three years, with practically no change in EPS being achieved in total. Accordingly, shareholders probably wouldn't have been overly satisfied with the unstable medium-term growth rates.
Weighing that recent medium-term earnings trajectory against the broader market's one-year forecast for expansion of 0.3% shows it's about the same on an annualised basis.
With this information, we find it odd that Gullewa is trading at a P/E lower than the market. It may be that most investors are not convinced the company can maintain recent growth rates.
The Bottom Line On Gullewa's P/E
It's argued the price-to-earnings ratio is an inferior measure of value within certain industries, but it can be a powerful business sentiment indicator.
We've established that Gullewa currently trades on a lower than expected P/E since its recent three-year growth is in line with the wider market forecast. There could be some unobserved threats to earnings preventing the P/E ratio from matching the company's performance. It appears some are indeed anticipating earnings instability, because the persistence of these recent medium-term conditions should normally provide more support to the share price.
Plus, you should also learn about these 4 warning signs we've spotted with Gullewa (including 1 which is a bit concerning).
If you're unsure about the strength of Gullewa's business, why not explore our interactive list of stocks with solid business fundamentals for some other companies you may have missed.
This article by Simply Wall St is general in nature. It does not constitute a recommendation to buy or sell any stock, and does not take account of your objectives, or your financial situation. We aim to bring you long-term focused analysis driven by fundamental data. Note that our analysis may not factor in the latest price-sensitive company announcements or qualitative material. Simply Wall St has no position in any stocks mentioned.
Have feedback on this article? Concerned about the content? Get in touch with us directly. Alternatively, email editorial-team@simplywallst.com.
