
 Yahoo Finance
 Federated (FHI) Q4 Earnings Meet Estimates, AUM Increases
Federated Hermes FHI reported fourth-quarter 2021 earnings per share of 71 cents, in line with the Zacks Consensus Estimate. The figure, however, compares unfavorably with the prior-year quarter’s earnings of 93 cents.
Controlled expenses and improved assets under management (AUM) were driving factors. Also, FHI’s liquidity position was strong. Yet, reduced net investment advisory fees and net service fees were deterrents.
Net income was $68.6 million compared with the year-ago quarter’s $95.2 million.
In 2021, Federated reported a net income of $270.3 million or $2.75 per share compared with $326.4 million or $3.23 in 2020.
Revenues Fall, Costs Decline, AUM Rises
Total revenues declined 12% year over year to $321.65 million. The year-over-year downside stemmed mainly from decreased net investment advisory fees and net administrative service fees.
Net investment advisory fees dropped 16% year over year to $223.8 million. In addition, administrative service fees fell 2% to $77.7 million. Net service fees (other) rose 5% to $20.1 million.
During the quarter, Federated derived 17% of its revenues from money market assets, 52% from equity, 19% from fixed-income assets, 10% from alternative/private markets and multi-asset, and the remaining 2% from sources other than managed assets.
Federated recorded non-operating expenses of $1.8 million, down substantially from $6.2 million earned in the prior-year quarter.
Total operating expenses slipped 6% year over year to $233.1 million. Lower distribution expenses, majorly resulting from higher voluntary yield-related fee waivers, and lower incentive compensation and related expenses led to this decline.
Asset Position Improves
As of Dec 31, 2021, total AUM came in at a record $668.9 billion, up 8% year over year. Average managed assets summed $640.4 billion, up 5% year over year.
Federated witnessed money-market assets of $447.9 billion, up 7% from the year-ago period’s level. Further, fixed-income assets were up 15.8% to $97.6 billion.
Equity assets of $96.7 billion rose 5.4% year over year. In addition, alternative market assets increased 20% to $20.92 billion.
As of Dec 31, 2021, cash and other investments were $426.7 million and a total long-term debt was $223.4 million compared with $438.8 million and $75 million, respectively, as of Dec 31, 2020.
Dividend Update
During the fourth quarter, Federated declared a quarterly dividend of 27 cents per share. The dividend will be paid out on Feb 15, 2022 to its shareholders of record as of Feb 8, 2022.
Our Viewpoint
Federated displays substantial growth potential, supported by its diverse asset and product mix as well as a solid liquidity position. Acquisitions are also anticipated to be beneficial for the company. Though uncertain markets pose a concern, higher AUM and prudent cost management will likely aid its bottom-line performance.
Federated Hermes, Inc. Price, Consensus and EPS Surprise
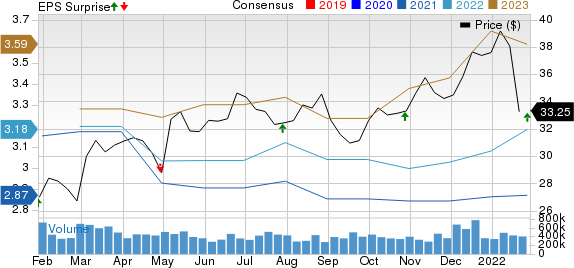
Federated Hermes, Inc. price-consensus-eps-surprise-chart | Federated Hermes, Inc. Quote
Currently, Federated carries a Zacks Rank #2 (Buy). You can see the complete list of today’s Zacks #1 Rank (Strong Buy) stocks here.
Performance of Other Finance Stocks
First Republic Bank’s FRC fourth-quarter 2021 earnings per share of $2.02 surpassed the Zacks Consensus Estimate of $1.91. Additionally, the bottom line improved 26.3% from the year-ago quarter’s level.
FRC’s quarterly results were supported by a higher net interest income and non-interest income. Moreover, First Republic’s balance-sheet position was strong in the quarter. However, higher expenses and elevated net loan charge-offs were the offsetting factors.
Citigroup Inc. C delivered an earnings surprise of 5.04% in fourth-quarter 2021. Income from continuing operations per share of $1.46 outpaced the Zacks Consensus Estimate of $1.39. However, the reported figure declined 24% from the prior-year quarter’s level.
Citigroup’s investment banking revenues jumped in the quarter under review, driven by equity underwriting and growth in advisory revenues. However, fixed-income revenues were down due to declining rates and spread products.
U.S. Bancorp USB reported fourth-quarter 2021 earnings per share of $1.07, which missed the Zacks Consensus Estimate of $1.11. Results, however, compare favorably with the prior-year quarter’s figure of 95 cents.
Though lower revenues and escalating expenses were disappointing factors, credit quality was a tailwind. Growth in loan and deposit balance and a strong capital position were also encouraging factors. Moreover, U.S. Bancorp closed the acquisition of San Francisco-based fintech firm TravelBank, which offers technology-driven cost and travel management solutions.
Want the latest recommendations from Zacks Investment Research? Today, you can download 7 Best Stocks for the Next 30 Days. Click to get this free report
Citigroup Inc. (C) : Free Stock Analysis Report
U.S. Bancorp (USB) : Free Stock Analysis Report
First Republic Bank (FRC) : Free Stock Analysis Report
Federated Hermes, Inc. (FHI) : Free Stock Analysis Report
To read this article on Zacks.com click here.
Zacks Investment Research
