
 Yahoo Finance
 Fairfax India Holdings Corporation (TSE:FIH.U) stock most popular amongst private companies who own 36%, while individual investors hold 33%
Key Insights
The considerable ownership by private companies in Fairfax India Holdings indicates that they collectively have a greater say in management and business strategy
52% of the business is held by the top 11 shareholders
Insiders have bought recently
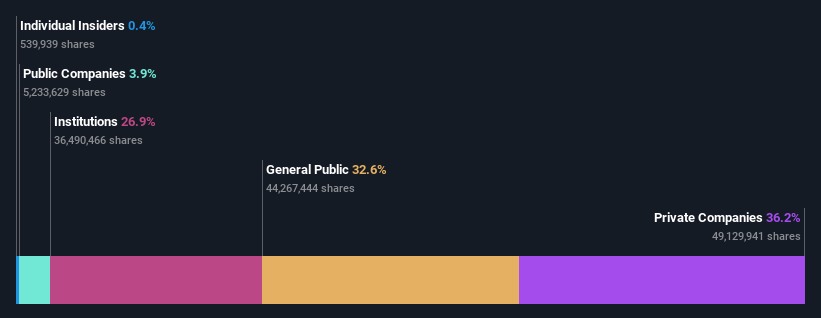
A look at the shareholders of Fairfax India Holdings Corporation (TSE:FIH.U) can tell us which group is most powerful. With 36% stake, private companies possess the maximum shares in the company. Put another way, the group faces the maximum upside potential (or downside risk).
Meanwhile, individual investors make up 33% of the company’s shareholders.
In the chart below, we zoom in on the different ownership groups of Fairfax India Holdings.
Check out our latest analysis for Fairfax India Holdings
What Does The Institutional Ownership Tell Us About Fairfax India Holdings?
Institutional investors commonly compare their own returns to the returns of a commonly followed index. So they generally do consider buying larger companies that are included in the relevant benchmark index.
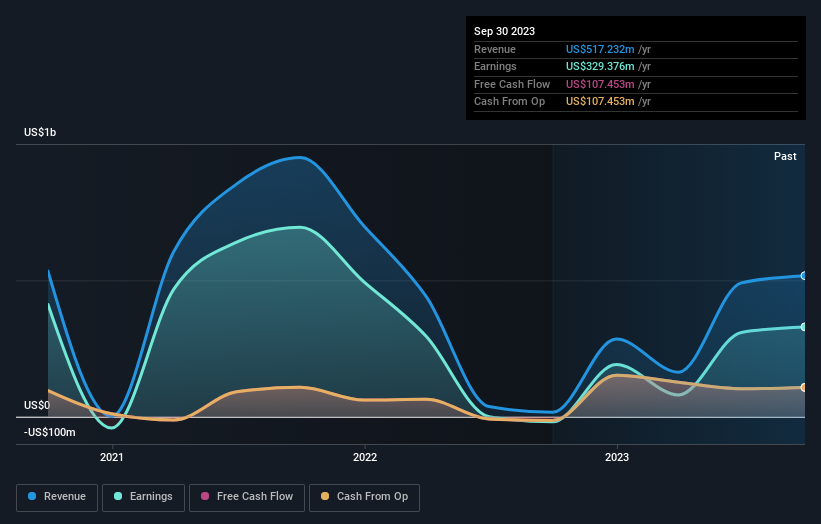
As you can see, institutional investors have a fair amount of stake in Fairfax India Holdings. This implies the analysts working for those institutions have looked at the stock and they like it. But just like anyone else, they could be wrong. When multiple institutions own a stock, there's always a risk that they are in a 'crowded trade'. When such a trade goes wrong, multiple parties may compete to sell stock fast. This risk is higher in a company without a history of growth. You can see Fairfax India Holdings' historic earnings and revenue below, but keep in mind there's always more to the story.
We note that hedge funds don't have a meaningful investment in Fairfax India Holdings. Our data shows that OMERS Administration Corporation is the largest shareholder with 15% of shares outstanding. With 9.7% and 6.1% of the shares outstanding respectively, United States Fire Insurance Company and Allied World Assurance Company, Ltd are the second and third largest shareholders.
Looking at the shareholder registry, we can see that 52% of the ownership is controlled by the top 11 shareholders, meaning that no single shareholder has a majority interest in the ownership.
While it makes sense to study institutional ownership data for a company, it also makes sense to study analyst sentiments to know which way the wind is blowing. As far as we can tell there isn't analyst coverage of the company, so it is probably flying under the radar.
Insider Ownership Of Fairfax India Holdings
The definition of company insiders can be subjective and does vary between jurisdictions. Our data reflects individual insiders, capturing board members at the very least. Management ultimately answers to the board. However, it is not uncommon for managers to be executive board members, especially if they are a founder or the CEO.
Insider ownership is positive when it signals leadership are thinking like the true owners of the company. However, high insider ownership can also give immense power to a small group within the company. This can be negative in some circumstances.
Our most recent data indicates that insiders own less than 1% of Fairfax India Holdings Corporation. We do note, however, it is possible insiders have an indirect interest through a private company or other corporate structure. Keep in mind that it's a big company, and the insiders own US$8.0m worth of shares. The absolute value might be more important than the proportional share. It is always good to see at least some insider ownership, but it might be worth checking if those insiders have been selling.
General Public Ownership
The general public, who are usually individual investors, hold a 33% stake in Fairfax India Holdings. This size of ownership, while considerable, may not be enough to change company policy if the decision is not in sync with other large shareholders.
Private Company Ownership
It seems that Private Companies own 36%, of the Fairfax India Holdings stock. It might be worth looking deeper into this. If related parties, such as insiders, have an interest in one of these private companies, that should be disclosed in the annual report. Private companies may also have a strategic interest in the company.
Public Company Ownership
We can see that public companies hold 3.9% of the Fairfax India Holdings shares on issue. This may be a strategic interest and the two companies may have related business interests. It could be that they have de-merged. This holding is probably worth investigating further.
Next Steps:
While it is well worth considering the different groups that own a company, there are other factors that are even more important.
I always like to check for a history of revenue growth. You can too, by accessing this free chart of historic revenue and earnings in this detailed graph.
Of course, you might find a fantastic investment by looking elsewhere. So take a peek at this free list of interesting companies.
NB: Figures in this article are calculated using data from the last twelve months, which refer to the 12-month period ending on the last date of the month the financial statement is dated. This may not be consistent with full year annual report figures.
Have feedback on this article? Concerned about the content? Get in touch with us directly. Alternatively, email editorial-team (at) simplywallst.com.
This article by Simply Wall St is general in nature. We provide commentary based on historical data and analyst forecasts only using an unbiased methodology and our articles are not intended to be financial advice. It does not constitute a recommendation to buy or sell any stock, and does not take account of your objectives, or your financial situation. We aim to bring you long-term focused analysis driven by fundamental data. Note that our analysis may not factor in the latest price-sensitive company announcements or qualitative material. Simply Wall St has no position in any stocks mentioned.
