
 Yahoo Finance
 Fairfax Financial Holdings Limited's (TSE:FFH) Recent Stock Performance Looks Decent- Can Strong Fundamentals Be the Reason?
Fairfax Financial Holdings' (TSE:FFH) stock is up by 3.8% over the past three months. Given that the market rewards strong financials in the long-term, we wonder if that is the case in this instance. Specifically, we decided to study Fairfax Financial Holdings' ROE in this article.
Return on equity or ROE is a key measure used to assess how efficiently a company's management is utilizing the company's capital. Put another way, it reveals the company's success at turning shareholder investments into profits.
See our latest analysis for Fairfax Financial Holdings
How Is ROE Calculated?
Return on equity can be calculated by using the formula:
Return on Equity = Net Profit (from continuing operations) ÷ Shareholders' Equity
So, based on the above formula, the ROE for Fairfax Financial Holdings is:
14% = US$3.0b ÷ US$21b (Based on the trailing twelve months to March 2022).
The 'return' is the yearly profit. Another way to think of that is that for every CA$1 worth of equity, the company was able to earn CA$0.14 in profit.
What Is The Relationship Between ROE And Earnings Growth?
We have already established that ROE serves as an efficient profit-generating gauge for a company's future earnings. Based on how much of its profits the company chooses to reinvest or "retain", we are then able to evaluate a company's future ability to generate profits. Assuming all else is equal, companies that have both a higher return on equity and higher profit retention are usually the ones that have a higher growth rate when compared to companies that don't have the same features.
Fairfax Financial Holdings' Earnings Growth And 14% ROE
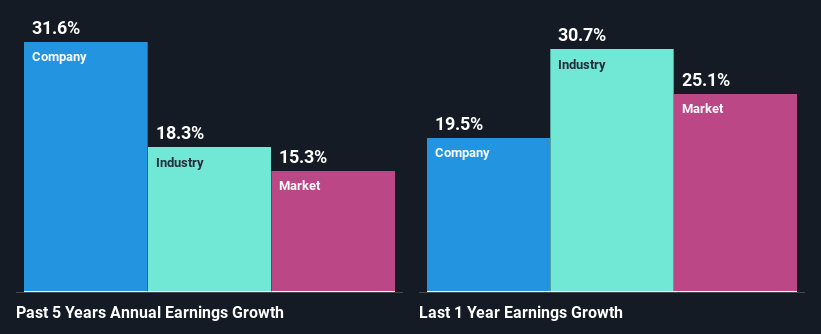
At first glance, Fairfax Financial Holdings seems to have a decent ROE. And on comparing with the industry, we found that the the average industry ROE is similar at 14%. Consequently, this likely laid the ground for the impressive net income growth of 32% seen over the past five years by Fairfax Financial Holdings. We believe that there might also be other aspects that are positively influencing the company's earnings growth. For instance, the company has a low payout ratio or is being managed efficiently.
As a next step, we compared Fairfax Financial Holdings' net income growth with the industry, and pleasingly, we found that the growth seen by the company is higher than the average industry growth of 18%.
The basis for attaching value to a company is, to a great extent, tied to its earnings growth. What investors need to determine next is if the expected earnings growth, or the lack of it, is already built into the share price. By doing so, they will have an idea if the stock is headed into clear blue waters or if swampy waters await. If you're wondering about Fairfax Financial Holdings''s valuation, check out this gauge of its price-to-earnings ratio, as compared to its industry.
Is Fairfax Financial Holdings Using Its Retained Earnings Effectively?
Fairfax Financial Holdings' ' three-year median payout ratio is on the lower side at 9.5% implying that it is retaining a higher percentage (91%) of its profits. This suggests that the management is reinvesting most of the profits to grow the business as evidenced by the growth seen by the company.
Besides, Fairfax Financial Holdings has been paying dividends for at least ten years or more. This shows that the company is committed to sharing profits with its shareholders.
Summary
On the whole, we feel that Fairfax Financial Holdings' performance has been quite good. In particular, it's great to see that the company is investing heavily into its business and along with a high rate of return, that has resulted in a sizeable growth in its earnings. Having said that, on studying current analyst estimates, we were concerned to see that while the company has grown its earnings in the past, analysts expect its earnings to shrink in the future. To know more about the latest analysts predictions for the company, check out this visualization of analyst forecasts for the company.
Have feedback on this article? Concerned about the content? Get in touch with us directly. Alternatively, email editorial-team (at) simplywallst.com.
This article by Simply Wall St is general in nature. We provide commentary based on historical data and analyst forecasts only using an unbiased methodology and our articles are not intended to be financial advice. It does not constitute a recommendation to buy or sell any stock, and does not take account of your objectives, or your financial situation. We aim to bring you long-term focused analysis driven by fundamental data. Note that our analysis may not factor in the latest price-sensitive company announcements or qualitative material. Simply Wall St has no position in any stocks mentioned.