
 Yahoo Finance
 F5, Inc. (NASDAQ:FFIV) Stock's Been Sliding But Fundamentals Look Decent: Will The Market Correct The Share Price In The Future?
F5 (NASDAQ:FFIV) has had a rough three months with its share price down 15%. But if you pay close attention, you might find that its key financial indicators look quite decent, which could mean that the stock could potentially rise in the long-term given how markets usually reward more resilient long-term fundamentals. Specifically, we decided to study F5's ROE in this article.
Return on Equity or ROE is a test of how effectively a company is growing its value and managing investors’ money. In simpler terms, it measures the profitability of a company in relation to shareholder's equity.
Check out our latest analysis for F5
How Do You Calculate Return On Equity?
The formula for ROE is:
Return on Equity = Net Profit (from continuing operations) ÷ Shareholders' Equity
So, based on the above formula, the ROE for F5 is:
17% = US$499m ÷ US$2.9b (Based on the trailing twelve months to March 2024).
The 'return' is the profit over the last twelve months. One way to conceptualize this is that for each $1 of shareholders' capital it has, the company made $0.17 in profit.
What Is The Relationship Between ROE And Earnings Growth?
Thus far, we have learned that ROE measures how efficiently a company is generating its profits. We now need to evaluate how much profit the company reinvests or "retains" for future growth which then gives us an idea about the growth potential of the company. Assuming all else is equal, companies that have both a higher return on equity and higher profit retention are usually the ones that have a higher growth rate when compared to companies that don't have the same features.
A Side By Side comparison of F5's Earnings Growth And 17% ROE
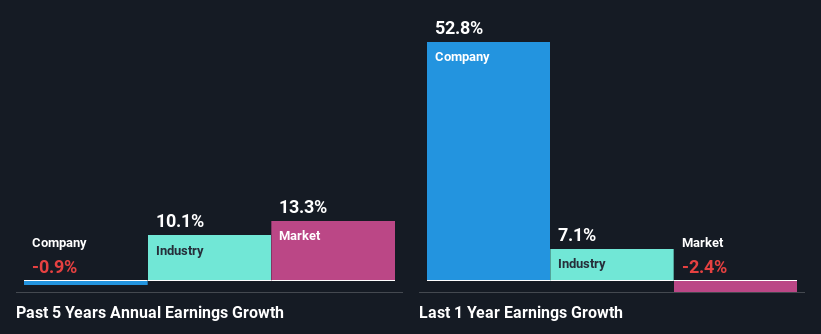
To start with, F5's ROE looks acceptable. Further, the company's ROE compares quite favorably to the industry average of 7.1%. Despite this, F5's five year net income growth was quite flat over the past five years. Therefore, there could be some other aspects that could potentially be preventing the company from growing. Such as, the company pays out a huge portion of its earnings as dividends, or is faced with competitive pressures.
Next, on comparing with the industry net income growth, we found that the industry grew its earnings by 10% over the last few years.
Earnings growth is an important metric to consider when valuing a stock. What investors need to determine next is if the expected earnings growth, or the lack of it, is already built into the share price. Doing so will help them establish if the stock's future looks promising or ominous. Is F5 fairly valued compared to other companies? These 3 valuation measures might help you decide.
Is F5 Using Its Retained Earnings Effectively?
F5 doesn't pay any regular dividends, meaning that potentially all of its profits are being reinvested in the business. However, this doesn't explain why the company hasn't seen any growth. So there could be some other explanations in that regard. For instance, the company's business may be deteriorating.
Conclusion
On the whole, we do feel that F5 has some positive attributes. Yet, the low earnings growth is a bit concerning, especially given that the company has a high rate of return and is reinvesting ma huge portion of its profits. By the looks of it, there could be some other factors, not necessarily in control of the business, that's preventing growth. With that said, we studied the latest analyst forecasts and found that while the company has shrunk its earnings in the past, analysts expect its earnings to grow in the future. Are these analysts expectations based on the broad expectations for the industry, or on the company's fundamentals? Click here to be taken to our analyst's forecasts page for the company.
Have feedback on this article? Concerned about the content? Get in touch with us directly. Alternatively, email editorial-team (at) simplywallst.com.
This article by Simply Wall St is general in nature. We provide commentary based on historical data and analyst forecasts only using an unbiased methodology and our articles are not intended to be financial advice. It does not constitute a recommendation to buy or sell any stock, and does not take account of your objectives, or your financial situation. We aim to bring you long-term focused analysis driven by fundamental data. Note that our analysis may not factor in the latest price-sensitive company announcements or qualitative material. Simply Wall St has no position in any stocks mentioned.
