
 Yahoo Finance
 Exploring Three Dividend Stocks In India For June 2024
In recent times, the Indian market has experienced a notable fluctuation, declining by 1.7% over the last week but showing a robust annual growth of 38%. In this dynamic environment, and with earnings expected to grow by 16% annually, dividend stocks can offer investors a blend of stability and potential income generation.
Top 10 Dividend Stocks In India
Name | Dividend Yield | Dividend Rating |
Balmer Lawrie Investments (BSE:532485) | 4.64% | ★★★★★★ |
Bhansali Engineering Polymers (BSE:500052) | 4.22% | ★★★★★★ |
D. B (NSEI:DBCORP) | 4.55% | ★★★★★☆ |
Castrol India (BSE:500870) | 3.99% | ★★★★★☆ |
ITC (NSEI:ITC) | 3.16% | ★★★★★☆ |
HCL Technologies (NSEI:HCLTECH) | 3.71% | ★★★★★☆ |
D-Link (India) (NSEI:DLINKINDIA) | 3.07% | ★★★★★☆ |
Balmer Lawrie (BSE:523319) | 3.04% | ★★★★★☆ |
Indian Oil (NSEI:IOC) | 8.56% | ★★★★★☆ |
PTC India (NSEI:PTC) | 3.87% | ★★★★★☆ |
Click here to see the full list of 22 stocks from our Top Dividend Stocks screener.
Let's uncover some gems from our specialized screener.
Gulf Oil Lubricants India
Simply Wall St Dividend Rating: ★★★★★☆
Overview: Gulf Oil Lubricants India Limited is a company engaged in manufacturing, marketing, and trading lubricants for the automotive and industrial sectors in India, with a market capitalization of approximately ₹48.51 billion.
Operations: Gulf Oil Lubricants India Limited generates its revenue primarily through the sale of lubricants, amounting to ₹33.01 billion.
Dividend Yield: 4.1%
Gulf Oil Lubricants India has shown a robust financial performance with a 32.6% earnings growth over the past year and forecasts an 11.64% annual growth rate. Despite its attractive price-to-earnings ratio of 15.8x, which is below the Indian market average, its dividend track record is marked by volatility and unreliability over the last decade. Dividends are adequately covered by both earnings and cash flows, with payout ratios of 57.4% and 62.7%, respectively. Recent management changes and auditor rotation could signal shifts in corporate governance or strategy ahead.

Gulf Oil Lubricants India
Simply Wall St Dividend Rating: ★★★★★☆
Overview: Gulf Oil Lubricants India Limited is engaged in the manufacturing, marketing, and trading of lubricants for the automotive and industrial sectors in India, with a market capitalization of approximately ₹48.51 billion.
Operations: Gulf Oil Lubricants India generates its revenue primarily through the sale of lubricants, amounting to ₹33.01 billion.
Dividend Yield: 4.1%
Gulf Oil Lubricants India, with a P/E ratio of 15.8x below the Indian market average, trades at an appealing value. Despite a high earnings growth of 32.6% last year and expectations of 11.64% annual growth, its dividend history is inconsistent with volatile payments over the past decade. Dividend sustainability is supported by a payout ratio of 57.4% and cash flow coverage at 62.7%. Recent executive and auditor changes may impact future governance or strategic direction.
HCL Technologies
Simply Wall St Dividend Rating: ★★★★★☆
Overview: HCL Technologies Limited, a global company, provides software development, business process outsourcing, and infrastructure management services with a market cap of approximately ₹3.78 trillion.
Operations: HCL Technologies Limited generates its revenue primarily from three segments: HCL Software at $1.41 billion, IT and Business Services at $9.80 billion, and Engineering and R&D Services at $2.12 billion.
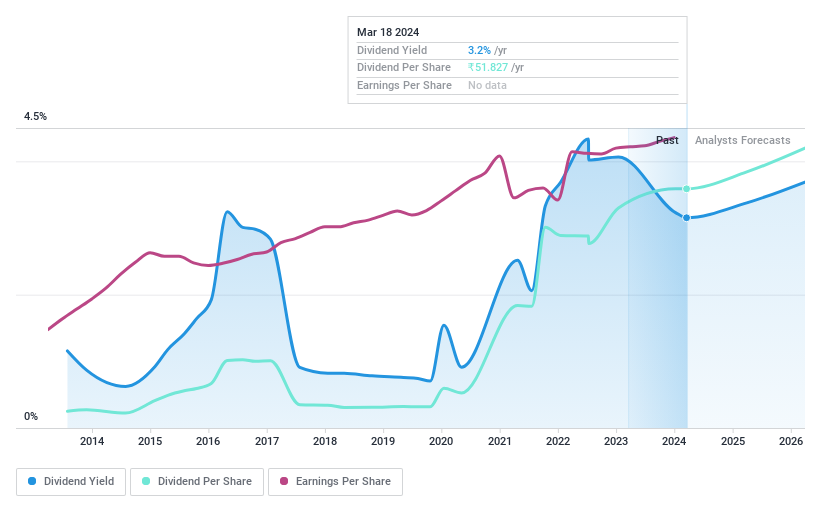
Dividend Yield: 3.7%
HCL Technologies, with a P/E ratio of 23.9x below the Indian market average, offers relative value but shows a volatile dividend history. Its recent interim dividend of INR 18 per share reflects a commitment to shareholder returns, supported by an earnings coverage at 89.1% and cash flow coverage at 65.1%. However, inconsistent dividend payments over the past decade may concern investors seeking stable income streams despite its strategic advancements in AI and cloud partnerships enhancing long-term business prospects.
Redington
Simply Wall St Dividend Rating: ★★★★★☆
Overview: Redington Limited operates as a supply chain solutions provider in India and internationally, with a market capitalization of approximately ₹160.46 billion.
Operations: Redington Limited generates its revenue from providing supply chain solutions across both domestic and international markets.
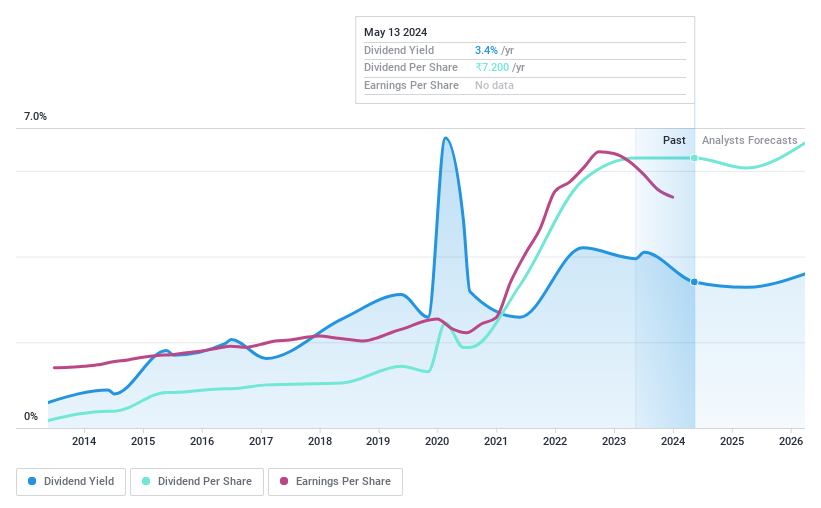
Dividend Yield: 3.5%
Redington, trading at a P/E of 13.2x, offers value below the Indian market average of 29.2x and is competitive within its industry. Despite a volatile dividend history over the past decade, recent financials show strength with annual sales rising to INR 893.46 billion from INR 793.77 billion year-over-year and net income reaching INR 12.19 billion. Dividends are supported by an earnings payout ratio of 40.4% and cash payout ratio of 58.8%, though future dividends will be considered in an upcoming board meeting on June 4, reflecting potential adjustments.
Key Takeaways
Gain an insight into the universe of 22 Top Dividend Stocks by clicking here.
Are these companies part of your investment strategy? Use Simply Wall St to consolidate your holdings into a portfolio and gain insights with our comprehensive analysis tools.
Simply Wall St is a revolutionary app designed for long-term stock investors, it's free and covers every market in the world.
Searching for a Fresh Perspective?
Explore high-performing small cap companies that haven't yet garnered significant analyst attention.
Fuel your portfolio with companies showing strong growth potential, backed by optimistic outlooks both from analysts and management.
Find companies with promising cash flow potential yet trading below their fair value.
This article by Simply Wall St is general in nature. We provide commentary based on historical data and analyst forecasts only using an unbiased methodology and our articles are not intended to be financial advice. It does not constitute a recommendation to buy or sell any stock, and does not take account of your objectives, or your financial situation. We aim to bring you long-term focused analysis driven by fundamental data. Note that our analysis may not factor in the latest price-sensitive company announcements or qualitative material. Simply Wall St has no position in any stocks mentioned.
Companies discussed in this article include NSEI:GULFOILLUB NSEI:GULFOILLUB NSEI:HCLTECH and NSEI:REDINGTON.
Have feedback on this article? Concerned about the content? Get in touch with us directly. Alternatively, email editorial-team@simplywallst.com
