
 Yahoo Finance
 When Can We Expect A Profit From Hastings Technology Metals Limited (ASX:HAS)?
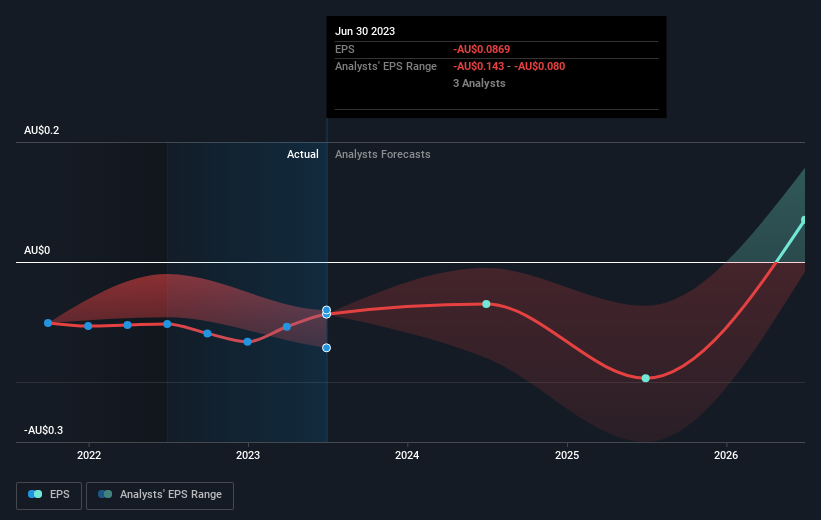
With the business potentially at an important milestone, we thought we'd take a closer look at Hastings Technology Metals Limited's (ASX:HAS) future prospects. Hastings Technology Metals Limited engages in the exploration and development of rare earth deposits in Australia. The AU$91m market-cap company announced a latest loss of AU$11m on 30 June 2023 for its most recent financial year result. The most pressing concern for investors is Hastings Technology Metals' path to profitability – when will it breakeven? In this article, we will touch on the expectations for the company's growth and when analysts expect it to become profitable.
Check out our latest analysis for Hastings Technology Metals
According to the 3 industry analysts covering Hastings Technology Metals, the consensus is that breakeven is near. They anticipate the company to incur a final loss in 2025, before generating positive profits of AU$29m in 2026. Therefore, the company is expected to breakeven roughly 3 years from now. What rate will the company have to grow year-on-year in order to breakeven on this date? Using a line of best fit, we calculated an average annual growth rate of 28%, which signals high confidence from analysts. Should the business grow at a slower rate, it will become profitable at a later date than expected.
Underlying developments driving Hastings Technology Metals' growth isn’t the focus of this broad overview, but, keep in mind that by and large a metal and mining business has lumpy cash flows which are contingent on the natural resource mined and stage at which the company is operating. This means, large upcoming growth rates are not abnormal as the company is beginning to reap the benefits of earlier investments.
One thing we would like to bring into light with Hastings Technology Metals is its relatively high level of debt. Typically, debt shouldn’t exceed 40% of your equity, which in Hastings Technology Metals' case is 42%. Note that a higher debt obligation increases the risk in investing in the loss-making company.
Next Steps:
There are too many aspects of Hastings Technology Metals to cover in one brief article, but the key fundamentals for the company can all be found in one place – Hastings Technology Metals' company page on Simply Wall St. We've also put together a list of relevant factors you should further research:
Valuation: What is Hastings Technology Metals worth today? Has the future growth potential already been factored into the price? The intrinsic value infographic in our free research report helps visualize whether Hastings Technology Metals is currently mispriced by the market.
Management Team: An experienced management team on the helm increases our confidence in the business – take a look at who sits on Hastings Technology Metals’s board and the CEO’s background.
Other High-Performing Stocks: Are there other stocks that provide better prospects with proven track records? Explore our free list of these great stocks here.
Have feedback on this article? Concerned about the content? Get in touch with us directly. Alternatively, email editorial-team (at) simplywallst.com.
This article by Simply Wall St is general in nature. We provide commentary based on historical data and analyst forecasts only using an unbiased methodology and our articles are not intended to be financial advice. It does not constitute a recommendation to buy or sell any stock, and does not take account of your objectives, or your financial situation. We aim to bring you long-term focused analysis driven by fundamental data. Note that our analysis may not factor in the latest price-sensitive company announcements or qualitative material. Simply Wall St has no position in any stocks mentioned.